
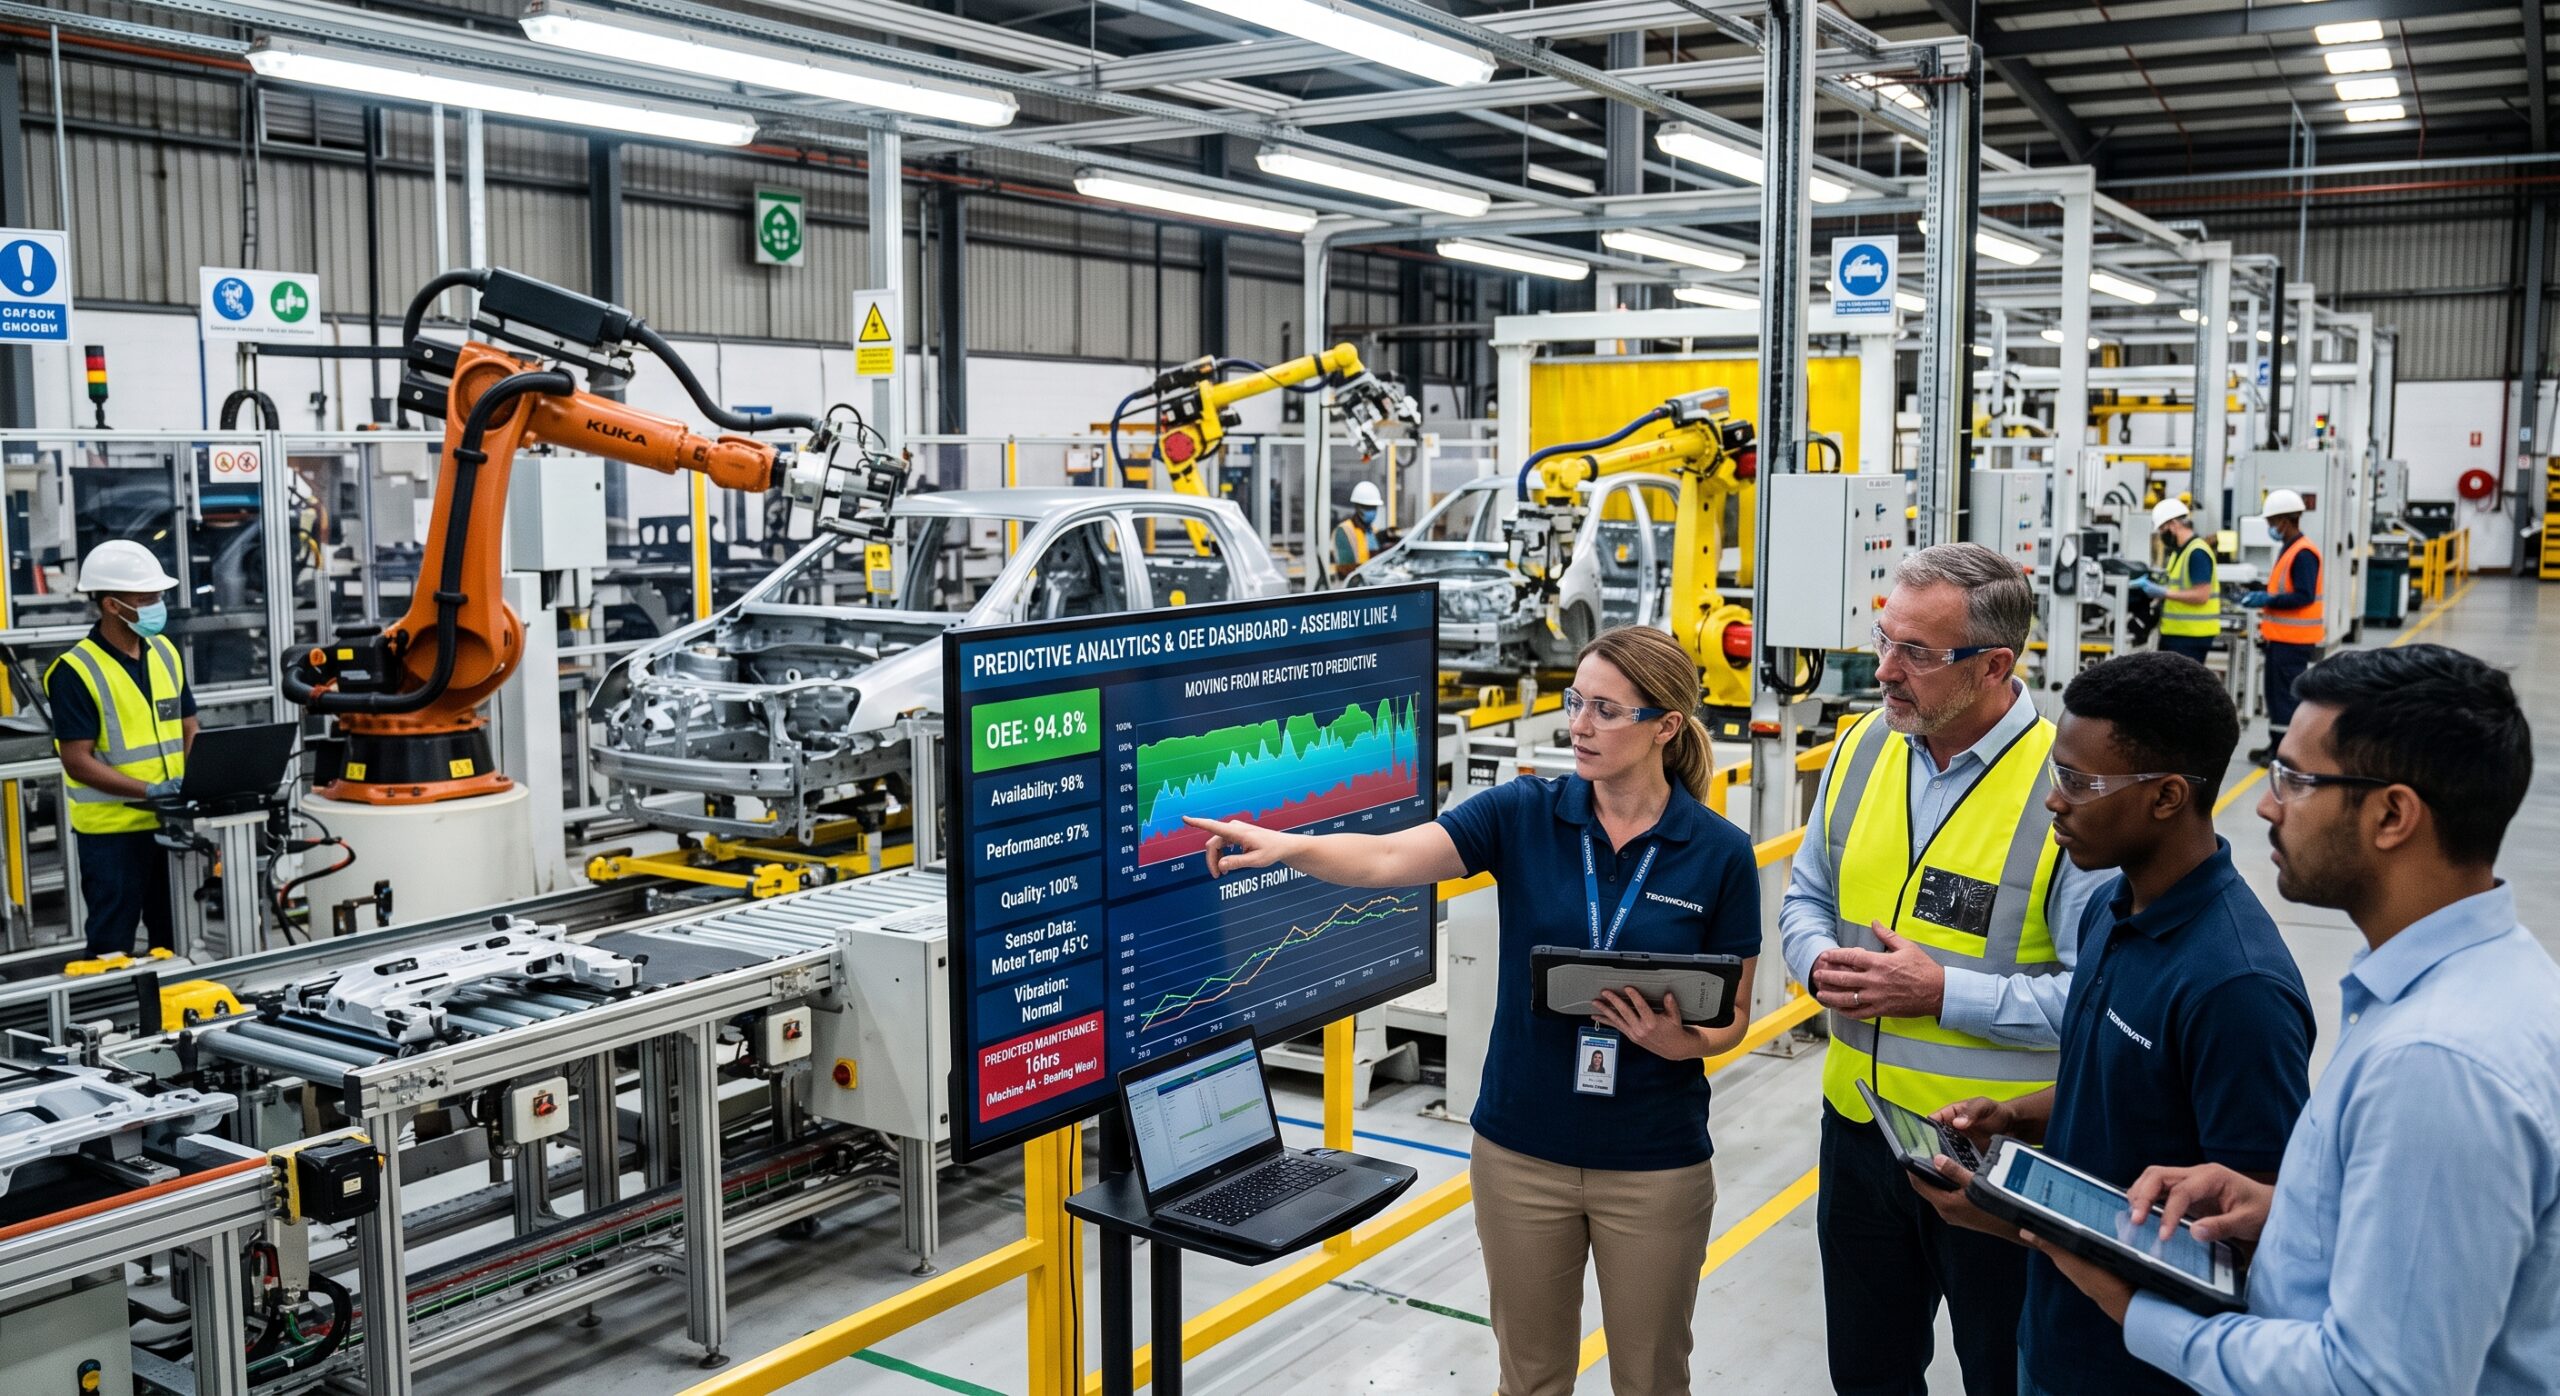
I spent my first few years walking plant floors with a laptop under my arm, pulling vibration logs off machines that had already failed. The pattern was always the same. A gearbox seizes at two in the morning, a line supervisor calls maintenance, maintenance calls me, and by the time I open the historian data, the damage is done. Everyone wants to know why nobody saw it coming, but the truth is usually that the data showed it, and nobody looked at it in time to act. That reality is the honest starting point for any predictive analytics manufacturing initiative teams are building today. This is not a story about artificial intelligence replacing technicians, but a story about closing the gap between when a machine signals it is getting sick and when a person finds out. Close that gap, and almost every metric a plant manager tracks, including overall equipment effectiveness (OEE), starts moving the right way.
The Real Cost of Staying Reactive
What Downtime Actually Costs
Reactive maintenance feels manageable until you total the real cost. Industrial manufacturers lose an estimated fifty billion dollars a year to unplanned downtime. Poor maintenance practices alone can strip five to twenty percent of a plant’s productive capacity. That is before anyone counts a single defect. Automotive assembly plants often price an hour of stopped production near 2.3 million dollars. That number explains why plant managers treat every unplanned stop like a small emergency rather than a routine ticket. This is exactly the cost a predictive analytics manufacturing program is built to prevent.
Why Reactive Repairs Cost More
Reactive maintenance hides its true cost across many line items. Running equipment to failure typically costs three to five times more than maintaining it proactively. Add up the expedited parts shipping, the overtime labor, and the secondary damage to nearby components. Then add the scrapped work in progress and the missed shipments that follow a dark line. The number grows fast. A bearing swap during a scheduled changeover might cost a few hundred dollars. Left alone, that same bearing can take out a spindle, a coupling, and half a shift’s output. A predictive analytics manufacturing approach catches that bearing weeks earlier, while the fix is still cheap.
None of this surprises anyone who has run a plant for more than a year. What changed is the toolset. Teams can now spot failures coming with equipment that is affordable and reliable. Manufacturers increasingly build that equipment into the machine itself rather than bolting it on later.
What Predictive Analytics Actually Means
The Sensor and Data Layer
Strip away the marketing language and predictive analytics on a manufacturing floor is a fairly simple pipeline. Sensors on rotating and reciprocating equipment capture vibration, temperature, current draw, acoustic emissions, and sometimes oil chemistry. Engineers clean that raw signal and time stamp it. They feed it into models trained on how those same signals behaved before past failures. The output is not a magic prediction of the exact hour something breaks. It is a shifting probability, a health score that drifts from ninety eight to eighty four over three weeks. That score tells a reliability engineer this specific asset needs attention before the next planned outage, not after it.
This approach differs from preventive maintenance, which swaps parts on a fixed calendar whether they need it or not. It also differs from simple condition monitoring, which only flags a value after it crosses a threshold. Predictive analytics manufacturing programs combine both ideas. They add statistical and machine learning models that account for load, ambient conditions, and each asset’s own maintenance history. The warning ends up specific to that machine rather than a generic rule copied from a manual.
Roughly forty percent of manufacturers say they have moved past preventive schedules into genuine predictive analytics. Most others still lean on calendar based preventive work as their main strategy. That gap holds most of the competitive advantage right now. Plants that made the jump are not just dodging breakdowns. They are cutting the time technicians spend planning work by twenty to fifty percent. They are also lifting equipment availability by ten to twenty percent, according to industry analysis tracking these programs.
Choosing the Right Model
The modeling choices matter more than most vendor pitches admit. Some failure modes show up clearly in vibration frequency spectra. Bearing wear on a high speed spindle is a good example. Simple anomaly detection handles it well once engineers capture the baseline signature. Other failures unfold slowly. A refrigerant leak in a chiller fits a different approach. So does fouling in a heat exchanger. Both suit a remaining useful life model built on survival analysis, because the real question is not whether the asset fails. It is how many operating days remain.
Gradient boosted trees work well for a different case. A plant needs a rich history of labeled failures and a modest number of sensor channels. Deep learning earns its added complexity only when a plant has years of high frequency time series data and a compute budget to match. Picking the wrong model for the failure mode is a common reason pilots underdeliver. That choice usually sits with the data science team, not the plant floor.
Where the Data Comes From
The data has to come from somewhere. This is where many programs stall before they ever reach the modeling stage. SCADA systems, programmable logic controllers, and manufacturing execution systems all hold pieces of the picture. Engineers originally built them for control and traceability, not analytics. Pulling clean, time aligned data out of them takes real integration work. Edge devices that pre process vibration and acoustic signals near the machine have eased this problem in recent years. They flag a feature of interest locally. Then they send a lighter data stream upstream, instead of pushing raw high frequency signals across a network built for something else entirely.
Why OEE Is the Metric That Matters
The Three Components of OEE
Plenty of plants track uptime as their headline number, but uptime alone hides too much. Overall equipment effectiveness multiplies three factors together: availability, performance, and quality. Picture a line that runs ninety percent of scheduled time. It hits ninety five percent of its rated speed and still makes ninety nine percent good parts. Those three numbers look respectable on their own. Multiplied together, they land at only about eighty five percent OEE, the figure most reliability professionals treat as world class.
Here is the uncomfortable part. Most manufacturing operations, even well run ones, sit closer to sixty percent OEE. A meaningful share of plants score below forty five percent. That shows up once someone measures all three components honestly instead of estimating them. The gap between sixty and eighty five is not a rounding error. It separates a plant that ships on time from one that is constantly firefighting.
Why the Math Is Unforgiving
Walk through the arithmetic once and the multiplication effect becomes clear. Set availability at ninety two percent, performance at ninety percent, and quality at ninety six percent. Each number sounds solid on its own. Multiply them together and the combined OEE lands near seventy nine percent. Drop any one number by a few points, which is exactly what an unnoticed equipment problem does. The compounded effect on the final figure is larger than most plant reviews admit. This is also why chasing one component in isolation rarely delivers the result a plant manager expects. A line that sprints to hit a performance target while quality quietly slips has not actually improved OEE. It has just moved the problem to a different column.
How Predictive Analytics Lifts Each Component
A predictive analytics manufacturing program pushes all three components at once. That is why it tends to move OEE faster than almost any other single initiative.
Availability improves because unplanned stops shrink. A pump that would have seized without warning instead trips an alert. The team schedules the repair into an existing changeover and fixes it without stopping the line a second time.
Performance improves because degraded equipment running below its rated speed usually shows early warning signs in the sensor data first. Catching a misaligned drive belt before it forces an operator to slow down protects real throughput. The same goes for a slowly failing bearing. Either one quietly drains output a plant was losing every shift.
Quality improves because a surprising number of defects trace back to equipment drift rather than material or operator error. One electronics manufacturer applied predictive monitoring to its assembly equipment. Defects dropped by a third, simply by catching process drift before it produced bad parts.
The Shift Itself: What Changes in a Predictive Analytics Manufacturing Program
Six Steps Most Programs Follow
Moving from reactive fixes to a predictive analytics manufacturing program is less a technology purchase. It is more a change in how maintenance, operations, and data teams talk to each other. Plants that make this transition well tend to work through six concrete steps, usually in this order.
First, they instrument the assets that matter most. They start with equipment that has historically caused the worst unplanned stops, rather than trying to sensor an entire plant at once. Second, they build a data pipeline that gets sensor readings into a place analysts and engineers can use. That sounds trivial and rarely is, especially in a plant running equipment from six different decades.
Third, teams build a failure mode library. They go back through years of work orders. They pair every past failure with the sensor behavior that came before it. This step usually takes the most labor and delivers the most value. Fourth, they train and validate models against real historical failures rather than trusting a vendor’s generic algorithm. A model tuned on someone else’s plant rarely transfers cleanly to another.
Fifth, they push the model’s output directly into the tools maintenance teams already use, typically a CMMS or EAM system. A health alert becomes a work order instead of an email nobody reads. Sixth, and this is the step most programs skip, they keep monitoring the models themselves. Equipment ages and processes change. A model that was accurate last year can quietly drift out of tune if nobody watches it.
What Payback Looks Like
Programs that follow something close to this sequence tend to see payback within 6 to 12 months. That timeline comes from industry data on industrial predictive maintenance deployments. Mature programs eventually cut unplanned downtime by thirty five to forty five percent. They also trim maintenance costs year over year by another twenty five to thirty percent on top of that.
What Results Actually Look Like
Examples Worth Trusting
Vendor case studies are easy to cherry pick and hard to verify independently, so I want to be careful here. That said, the pattern across independently reported examples holds up. A robotic manufacturing line that added predictive monitoring cut downtime in half. It also gained a twenty five percent jump in throughput. A rail operator applying predictive analytics to its fleet reduced downtime by five to eight percent. That operator runs an annual maintenance budget in the billions, so even a modest percentage turns into real money at that scale. A chemical manufacturer piloted the approach on a single high value asset. It avoided eighty percent of that asset’s prior unplanned downtime and saved roughly three hundred thousand dollars in the process. These are the kinds of results a predictive analytics manufacturing program should produce within the first year.
Start Small, Then Expand
Almost every credible example shares one trait. The biggest wins came from a small number of critical assets. They did not come from blanketing an entire facility with sensors on day one. Reliability teams that succeed tend to rank equipment by failure cost and criticality first. They expand the program only after the first few wins prove the model out and earn budget for the next phase.
Bringing the Workforce Along
Earning Technician Trust
None of this works if the people on the floor do not trust it. Trust has to be earned, not announced in a meeting. Technicians who spent fifteen years learning to hear a bad bearing are rightly skeptical of a dashboard that claims to know better. Honestly, sometimes the dashboard does not know better in the first few months. Programs that stick are the ones where a model’s early predictions get checked against a technician’s judgment out loud. When the model misses, the team discusses it instead of quietly logging it. The technician’s read on a machine then changes how the model gets tuned going forward.
Closing the Skills Gap
There is also a skills gap that is easy to underestimate. A maintenance team built around scheduled inspections and a data science team built around model accuracy speak different languages. A plant needs someone who can translate between the two. Usually that is a reliability engineer, someone who understands the mechanical failure modes and enough statistics to question a model’s output rather than accept it blindly. Manufacturers that invest in that translation role early tend to scale their programs faster. Others hire a data science team and simply expect maintenance staff to adapt on their own. Training does not need to turn every technician into an analyst. It needs to teach them when to trust an alert, when to question one, and how to report back what happened at the machine. A predictive analytics manufacturing program that skips this step never earns the trust it needs to last.
Where These Programs Go Wrong
Alerts Nobody Acts On
The failure pattern I see most often is not a bad algorithm. It is a plant that buys sensors and software, fills a dashboard with health scores, and never changes how work gets assigned on the floor. A predictive alert sitting in a portal nobody checks is worthless. The alert has to turn into a work order. That work order then has to compete fairly against everything else on a technician’s list. Skip that step, and the whole investment quietly dies within a year while the vendor invoice keeps arriving.
Skipping the Failure Mode Library
The second common mistake is trusting a generic model straight out of the box. Skipping the failure mode library entirely usually goes with it. Every plant’s equipment, load profile, and maintenance history differ enough that a model needs local tuning to earn trust. Skip that step, and technicians learn within a few false alarms that the system cries wolf. Once that trust is gone, it is nearly impossible to win back with the same tool.
Treating This as a Data Science Project Alone
A third mistake is treating the whole effort as a data science project. Too often, an analytics team owns it while sitting apart from the plant floor. The most durable programs I have joined paired a data scientist with a reliability engineer and a senior technician from day one. The technician usually knows which failure signatures actually matter long before any model does. That knowledge has to make it into the training data, or the predictive analytics manufacturing model never gets past the pilot stage.
Getting Started Without Overreaching
If a plant is starting from close to zero, the instinct to sensor everything and build one grand unified model is understandable. It is also almost always a mistake. A better starting point is picking the handful of assets responsible for the worst downtime over the past two years. Instrument only those, then prove the approach with a tight, well documented pilot before asking for a bigger budget. Success there builds the internal case far better than any slide deck. It also gives the maintenance team a real reason to trust the next alert on their screen.
The plants that get this right are not necessarily the ones with the biggest analytics budgets. They are the ones that treat a predictive analytics manufacturing program as an operating discipline rather than a software license. That discipline connects sensor data, maintenance history, and the judgment of the people who work on the equipment every day. Get that connection right, and OEE stops being a number reviewed once a month in a meeting. It becomes something the whole plant can watch move in real time.
Frequently Asked Questions
What is predictive analytics in manufacturing?
It uses sensor data, historical maintenance records, and statistical or machine learning models to estimate how likely a specific piece of equipment is to fail within a coming window of time, so a team can schedule repairs before an unplanned stop occurs. Tractian’s guide to predictive maintenance analytics covers the technical side in more depth: https://tractian.com/en/blog/predictive-maintenance-analytics
How is predictive maintenance different from preventive maintenance?
Preventive maintenance follows a fixed schedule no matter an asset’s actual condition. Predictive maintenance uses real time data to trigger work only when equipment shows genuine signs of degrading. Most mature predictive analytics manufacturing strategies use both. Verdantis breaks down adoption rates and cost differences between the two approaches here: https://www.verdantis.com/predictive-and-preventive-maintenance-statistics/
What OEE score should a manufacturing plant aim for?
Most reliability engineers treat eighty five percent OEE as world class, built from roughly ninety percent availability, ninety five percent performance, and ninety nine percent quality. Most plants currently run closer to sixty percent. The OEE Foundation explains the benchmark and why the multiplicative formula makes it hard to reach: https://www.oee.com/world-class-oee/
How long does it take to see a return on a predictive analytics program?
Industrial predictive maintenance programs typically pay back within six to twelve months. Mature deployments reduce unplanned downtime by thirty five to forty five percent over time. Oxmaint’s ROI research lays out case study figures and payback timelines: https://oxmaint.com/blog/post/blog-post-predictive-maintenance-roi-case-studies
Do smaller manufacturers need a large budget to start a predictive maintenance program?
No. Most successful programs start with a small number of critical, high failure cost assets rather than a facility wide rollout, which keeps the initial investment modest while still proving measurable value. Deloitte’s research on predictive technologies for asset maintenance walks through this phased approach: https://www.deloitte.com/us/en/insights/industry/manufacturing-industrial-products/industry-4-0/using-predictive-technologies-for-asset-maintenance.html
References
Deloitte Insights. Industry 4.0 and predictive technologies for asset maintenance. https://www.deloitte.com/us/en/insights/industry/manufacturing-industrial-products/industry-4-0/using-predictive-technologies-for-asset-maintenance.html
Verdantis. Predictive and Preventive Maintenance Statistics. https://www.verdantis.com/predictive-and-preventive-maintenance-statistics/
OEE Foundation. World Class OEE: Set Targets To Drive Improvement. https://www.oee.com/world-class-oee/
Oxmaint. Predictive Maintenance ROI: Real Case Studies and Cost Savings. https://oxmaint.com/blog/post/blog-post-predictive-maintenance-roi-case-studies
Tractian. 2026 Complete Guide to Predictive Maintenance Analytics. https://tractian.com/en/blog/predictive-maintenance-analytics