

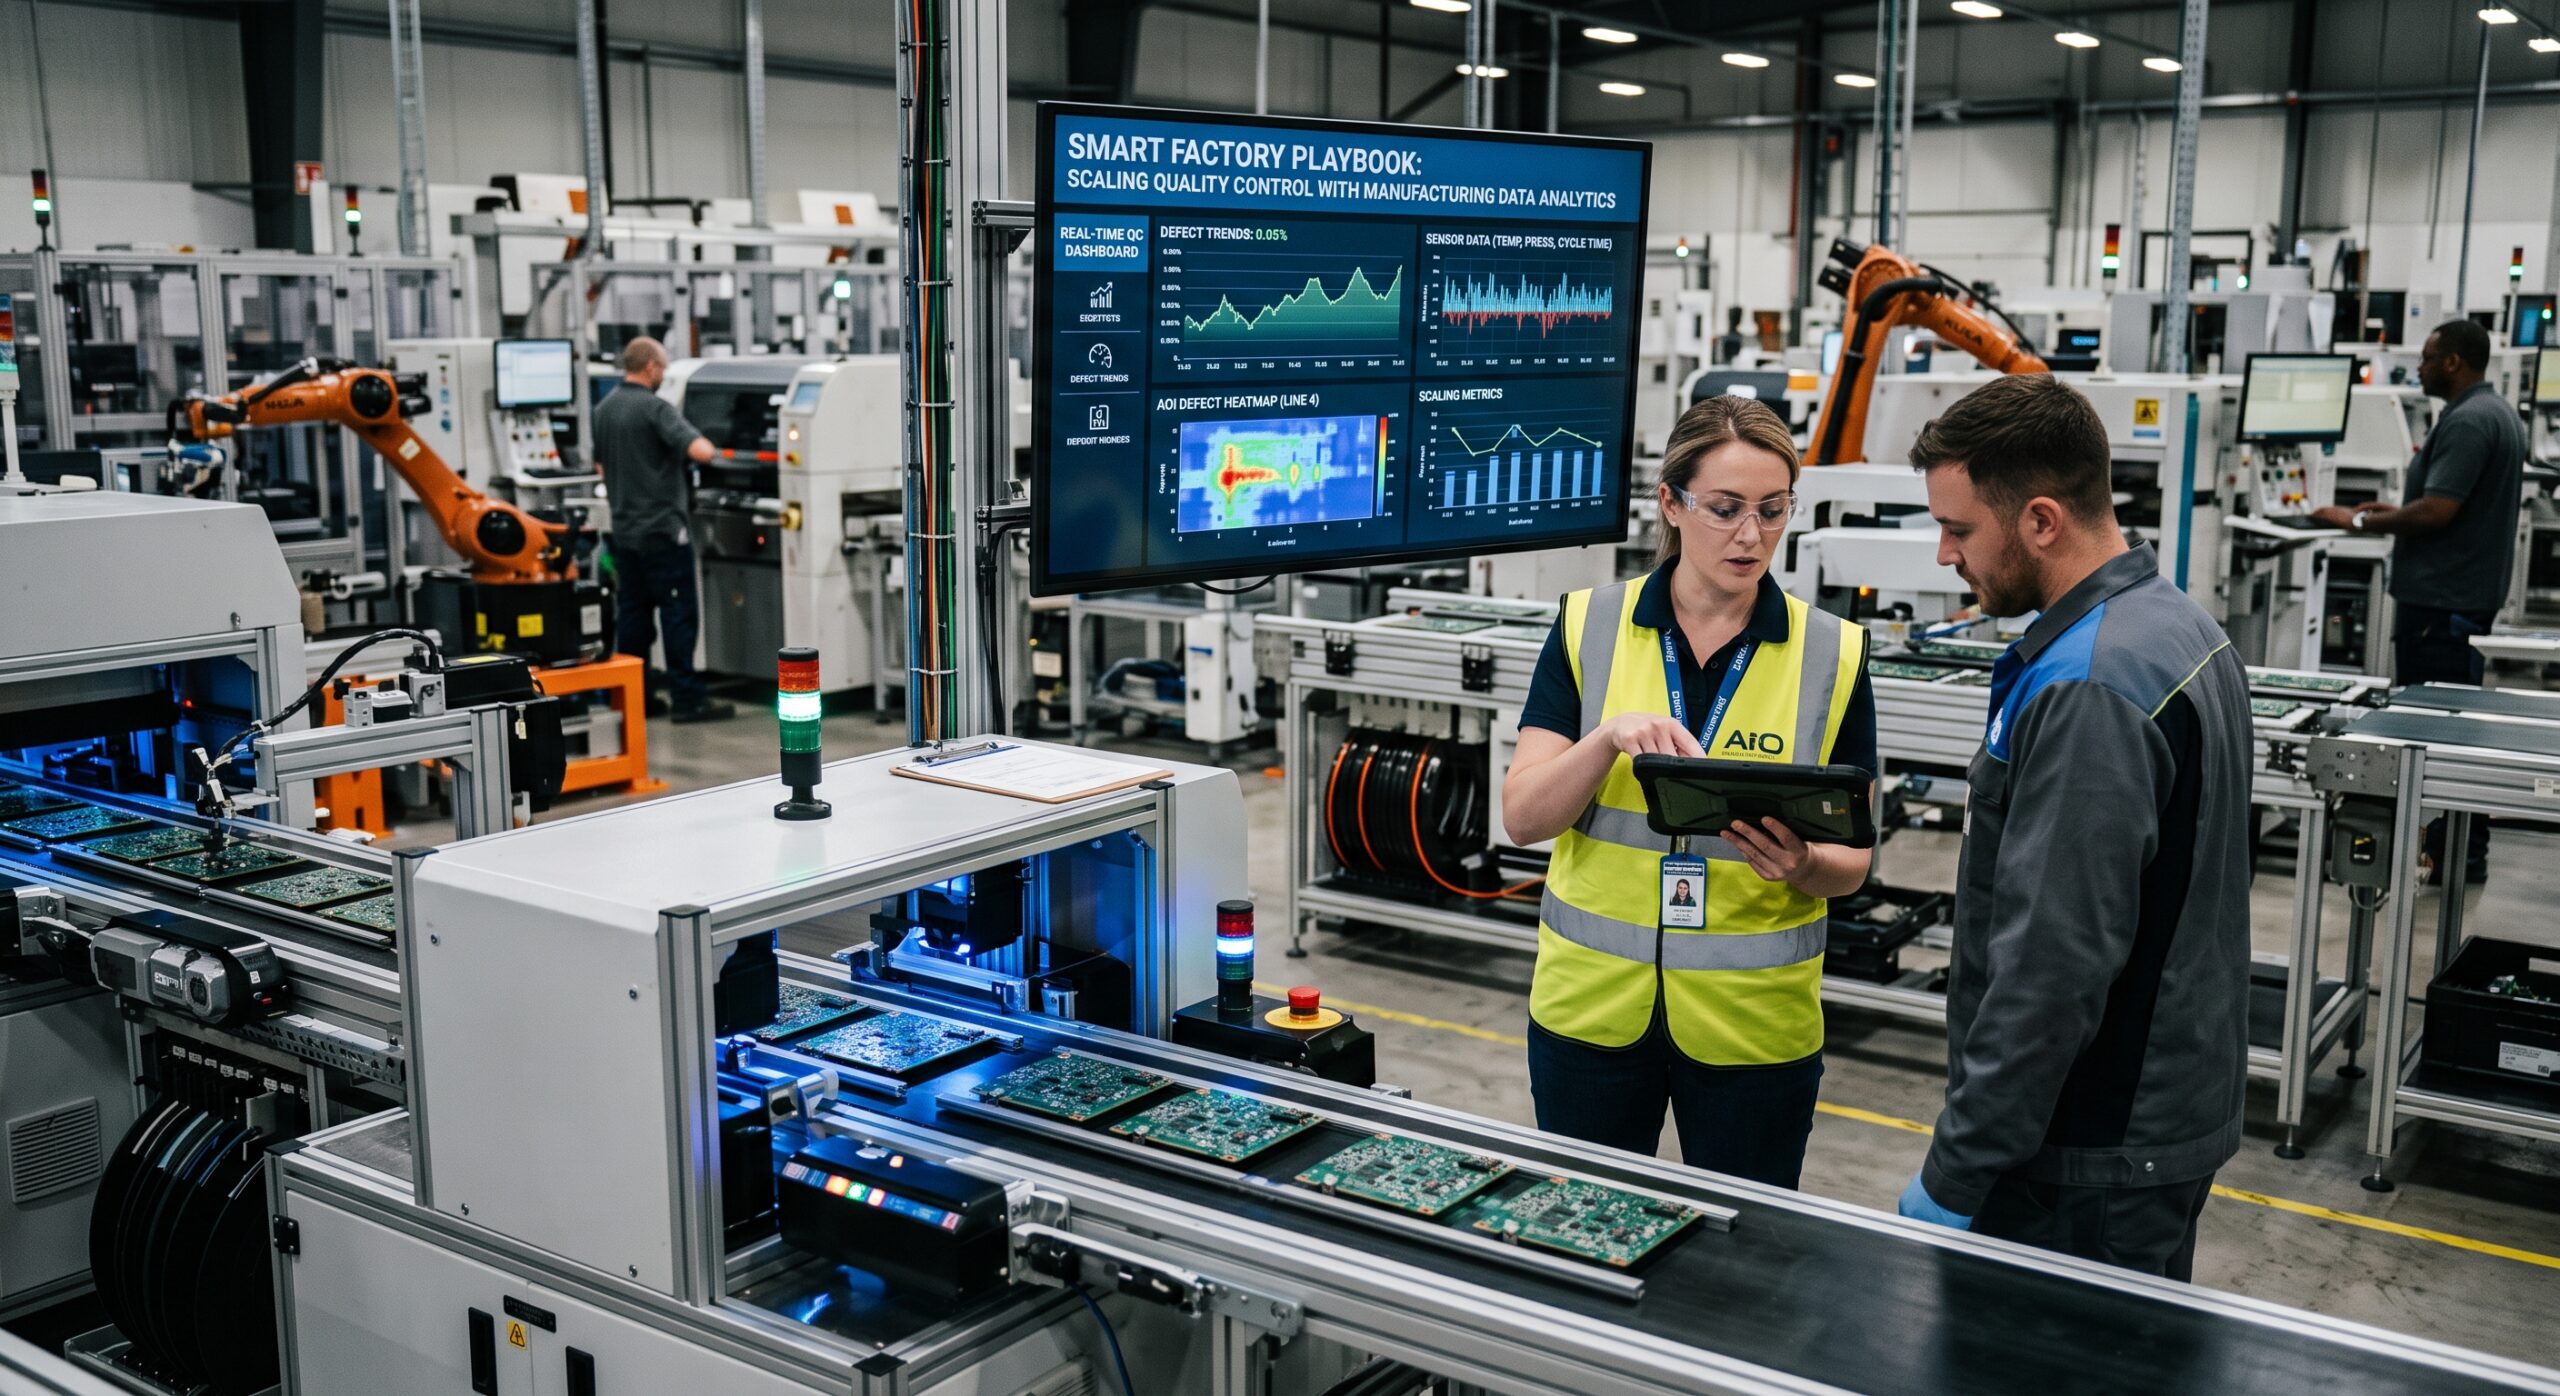
I spent the first part of my career walking production floors with a clipboard. I spent the second part walking the same floors with a laptop full of sensor logs. The clipboard never told me why line 3 kept falling behind on Tuesdays. The data did. That shift, from guessing to knowing, is the whole story of manufacturing data analytics. It’s why so many plant managers are finally willing to sit through a meeting about historians, tags, and dashboards. They used to tune all of that out.
This isn’t a theoretical piece. I’ve spent close to a decade building data pipelines for automotive suppliers and food and beverage lines. I’ve also worked with a couple of electronics assembly plants that would rather not be named. What follows is the playbook I actually use when a plant asks for help with bottlenecks and scrap. No hype, just what works, what doesn’t, and what I wish someone had told me on day one.
Why Bottlenecks Keep Coming Back
Every plant manager I’ve worked with can name their bottleneck. The problem is that the bottleneck they name is usually the symptom, not the source. A packaging line that keeps starving isn’t slow. It’s starving because an upstream machine has a changeover pattern nobody logged. Or because a supplier’s shipment variability never got tied back to the MRP system.
The Tribal Knowledge Problem
Before manufacturing data analytics became affordable and practical, plants managed this with tribal knowledge. The senior operator who’d been there 20 years knew which machine to babysit on a hot day. That knowledge walked out the door the moment that operator retired. I’ve seen it happen twice. Both times, the plant lost three to six months of throughput. A new team had to relearn lessons that sat unused in a historian database the whole time.
The Ripple Effect From Suppliers
Supply chains compound the problem. A single missed delivery window from a tier two supplier can ripple through a production schedule for weeks. Most plants only find out when the line actually stops. That’s reactive, not predictive, and reactive costs money. McKinsey’s research on advanced manufacturing looked at companies applying Industry 4.0 practices at scale. It found they cut unplanned downtime by as much as 25 percent. They also cut manufacturing costs by more than 10 percent at leading plants. Those aren’t small numbers when you’re running three shifts.
Data That Never Talks to Itself
The pattern I see across nearly every client is the same. Data exists somewhere in the plant. PLCs log it. SCADA systems store it. ERP systems hold purchase orders and lead times. None of it talks to the rest, so nobody sees the full picture until it’s too late to act.
How Smart Factories Actually Collect and Use Big Data
Robots and fancy dashboards don’t make a factory smart. A continuous, trustworthy flow of data from the physical process makes that happen instead. It has to reach a system where humans and algorithms can act on it in time. That distinction matters more than people think.
Instrumentation on the Floor
On the floor, this starts with instrumentation. Vibration sensors track rotating equipment. Thermal sensors watch ovens and furnaces. Current draw sensors monitor motors. Vision systems watch inspection stations. All of it feeds a layer that most engineers call the historian. In a lot of the plants I work with, we pull data from 9 separate sensor types on a single line. That’s before we even touch the quality system. That’s a modest setup by today’s standards.
Turning Raw Data Into Context
Raw sensor values are close to useless without context. A vibration reading of 4.2 millimeters per second means nothing on its own. You need the equipment type, the expected baseline, the shift, and the product running at that moment. This is where a lot of manufacturing data analytics projects fall apart. Teams buy sensors, dump the data into a cloud data lake, and then wonder why nobody uses it. Data without context is just noise with a timestamp.
Edge and Cloud, Working Together
Once the data has context, it gets useful fast. Edge computing handles split second decisions, like shutting a valve before a pressure spike damages a seal. Cloud platforms handle the heavier lifting. Think trend analysis across dozens of production lines, cross plant benchmarking, and machine learning models that spot patterns no human would catch by staring at a chart. IBM’s research on smart manufacturing points to this same layered approach. It combines IIoT for real time monitoring and AI for pattern detection. Digital twins let teams test changes before they touch a live line.
Where Digital Twins Actually Fit
I want to be honest about something here. People talk about digital twins like they’re magic, but sometimes they’re closer to a very expensive spreadsheet with a nice interface. The real value isn’t the twin itself. It’s the discipline of building a model accurate enough that testing a change in software actually predicts what happens on the floor. Most plants aren’t there yet, and that’s fine. Start with the sensors and the contextualization. The twin can come later.
From Data to Decisions: Killing Bottlenecks for Good
Here’s where manufacturing data analytics earns its keep. Once you have clean, contextualized data flowing continuously, you can finally answer the question that clipboard never could. Where, specifically, are you losing time and material, and why.
A Bottleneck That Wasn’t What It Looked Like
I worked with a mid sized automotive parts supplier with a chronic bottleneck at final assembly. Everyone assumed it was operator speed. When we mapped actual cycle times against upstream machine states, a different story emerged. A stamping press upstream had a changeover process that varied wildly by operator. The gap ran as high as 9 minutes per changeover. That variability rippled downstream and created the exact starvation pattern that looked, from the outside, like an assembly problem. Once we standardized the changeover sequence and used the data to coach operators, the bottleneck moved somewhere else entirely. That’s usually how this works. You don’t eliminate constraints, you relocate them to where they’re cheaper to manage.
Seeing Supply Problems Before They Hit the Line
Supply chain bottlenecks respond to the same treatment, just with a wider lens. Plants that tie supplier delivery data, inbound quality data, and production scheduling into a shared analytics layer gain real lead time. They can see a late shipment coming days before it hits the line, not hours. That gives planners room to reschedule, pull from safety stock intelligently, or shift production sequencing to buy time. NetSuite’s overview of smart factory maturity describes this as moving from what they call proactive data to active data. In that stage, systems don’t just store information, they analyze it well enough to recommend a response.
Why Visibility Beats More Inventory
The part that surprises people is how often the fix isn’t a new machine or a bigger warehouse. It’s visibility. A plant I consulted for in the food and beverage space carried almost 3 weeks of extra buffer stock. Nobody trusted the supply data enough to run leaner. We built a dashboard that traced ingredient lots from supplier truck to finished pallet with reliable lead time accuracy. Within two quarters, they cut that buffer nearly in half, freeing up warehouse space and cash that had been sitting frozen in inventory.
Getting the Floor to Trust the Data
None of this works without buy in from the people running the equipment, and that’s worth saying plainly. I’ve seen beautifully built dashboards sit ignored because operators had no part in building them and didn’t trust the numbers. The best manufacturing data analytics programs I’ve been part of treated the floor staff as co-designers, not end users receiving a report.
Scaling Quality Control the Right Way
Quality control is where manufacturing data analytics shifts from nice to have to genuinely mission critical. A quality escape doesn’t just cost scrap, it costs trust with a customer and sometimes a recall.
The Limits of Manual Sampling
Traditional statistical process control has been around for decades, and it still works. The problem was always scale. A quality engineer manually pulling samples every 30 minutes can catch a slow drift, but will miss a fast one. They definitely can’t watch 9 lines at once. Automated data collection changes that math entirely. When every measurement from every station feeds into a control system continuously, you catch a process drifting out of specification in minutes instead of hours. Sometimes you catch it before a single defective part ships.
What Machine Vision Actually Changes
Machine vision has done more for quality control in the last few years than almost any other technology I’ve deployed. A camera paired with a trained model can inspect a weld, a solder joint, or a label placement far faster than a person can. It’s also more consistent than someone eight hours into a shift. What makes this a manufacturing data analytics story, not just an automation story, is what happens to the inspection data afterward. Every flagged defect carries the exact machine state, operator, shift, and material lot from that moment. Over time, that dataset tells you which upstream conditions actually cause defects, not which ones you assumed caused them.
A Humidity Problem Nobody Saw Coming
I worked on a project where the assumption going in was that defect rates spiked because of a particular raw material supplier. The data told a different story. Scrap rates actually tracked ambient humidity in the plant during certain shifts, something nobody had thought to track before. We adjusted environmental controls for that window, and scrap dropped from 9 percent to under 3 percent in about ten weeks. That’s the kind of finding you only get by measuring everything and letting the data challenge your assumptions instead of confirming them.
Why I Hold Off on Predictive Quality
Predictive quality takes this a step further. Instead of catching a defect after it happens, models trained on historical process and quality data can flag when a batch is trending toward a likely failure before it’s even finished. This is genuinely difficult to do well. It requires enough historical data, labeled honestly, and a model you retrain as processes change. I’d rather see a plant nail solid real time SPC and vision inspection before chasing predictive quality models. A shaky foundation makes the fancier stuff unreliable and erodes trust in the whole program fast.
Building Your Own Playbook
If you’re starting from close to zero, here’s roughly the order I tackle this in, based on what has actually worked across the plants I’ve supported.
Start With the Fundamentals
First, get your data infrastructure honest before anything else. Audit what sensors and systems already exist. Check what people actually capture versus what they assume gets captured, then fix the gaps. I can’t count how many projects started with someone confidently saying a machine logs cycle time, only to find the tag broke eight months earlier.
Second, contextualize before you analyze. Tie every data point to a product, an operator, a shift, and a machine state. Skipping this step is the single most common reason analytics projects stall out after the initial excitement fades.
Third, start with a narrow, visible win. Pick one bottleneck or one quality issue everyone already agrees is painful, and solve it with data before trying to boil the ocean. Momentum and trust matter more early on than scope.
Bring People In and Stay Disciplined
Fourth, bring operators and quality staff into the process from day one. They know things about the equipment that no sensor captures. They’ll trust a system they helped shape far more than one handed down from a corporate office.
Fifth, connect the quality data and the supply chain data into the same analytics environment, even if it’s imperfect at first. Bottlenecks and quality escapes are more connected than most org charts suggest, since procurement, quality, and production usually sit in separate departments even though their data tells one continuous story.
Sixth, resist the urge to buy a massive platform before you’ve proven value with something smaller. I’ve watched plants sink budget into enterprise analytics suites that sat half configured for a year because nobody had validated the use case first.
Measuring Whether It’s Actually Working
One thing I insist on with every client is picking real metrics before the project starts, not after. Too many teams judge manufacturing data analytics initiatives by how nice the dashboard looks, not by whether the plant actually performs better. That’s backwards, and it’s how good programs lose funding in year two.
Pick Metrics You Already Trust
The metrics I come back to again and again are overall equipment effectiveness, first pass yield, scrap rate, unplanned downtime hours, and supplier on time delivery rate. None of these are exotic. Plants have tracked the same numbers for decades, often on a whiteboard near the break room. What changes with manufacturing data analytics is the frequency and the granularity. Instead of a weekly OEE number calculated by hand, you get it by shift, by line, by product family. You can trace a dip back to a specific cause within minutes instead of guessing at a Friday meeting three weeks later.
Watch How Often People Actually Use the Data
I’d also encourage plants to track a metric everyone ignores: how often people actually use the data to make a decision. It’s easy to build a reporting layer that technically works while supervisors still run the floor on gut feel, because nobody built the habit of checking the numbers first. I’ve started asking clients to log, informally, how many operational decisions each week cite a specific data point. When that number sits near zero, the technology isn’t the problem. Adoption is.
Track the Near Misses Too
Cost avoidance is harder to measure but worth the effort. A late shipment that a team catches and reroutes 4 days early because of supply chain visibility doesn’t look like a dramatic win, since the disaster never happened. I ask clients to log these near misses anyway, even informally. Six months in, that list is often the most convincing evidence for expanding the program that anyone in finance will actually read.
Where This Goes Wrong
I’d be doing you a disservice if I only told success stories. The most common failure mode I see is treating manufacturing data analytics as an IT project instead of an operations project. IT can build the pipeline, but if operations and quality aren’t driving what questions get asked, you end up with dashboards nobody opens after the second week.
The second failure mode is chasing sophistication too early. A plant that can’t get basic real time visibility working reliably has no business trying to deploy machine learning models for predictive maintenance. Build the foundation first.
The third failure mode, and honestly the most human one, is forgetting that this is change management as much as it’s technology. People who’ve run a process a certain way for years will resist being told a dashboard knows better. They’re not wrong to be skeptical until the data proves itself repeatedly and transparently.
Bringing It Together
Manufacturing data analytics isn’t a silver bullet, and anyone who tells you otherwise hasn’t spent enough time on an actual production floor. What it does is let you see what was always happening but stayed invisible before: the changeover variability, the humidity swing, the supplier pattern everyone suspected but nobody could prove. Once you can see it, you can fix it. Once you can fix it repeatedly, you’ve built something closer to a real smart factory than any brochure ever describes.
Start small, keep the people who run the equipment close to the process, and let the data challenge your assumptions instead of just confirming them. That’s the whole playbook, really. Everything else is implementation detail.
Frequently Asked Questions
What exactly is manufacturing data analytics?
It’s the practice of collecting data from machines, sensors, quality systems, and supply chain sources. Analysts then use it to improve decisions on the plant floor. It ranges from basic dashboards showing current line status to predictive models that flag quality issues before they happen. IBM has a solid overview of the underlying technologies at ibm.com/think/topics/smart-manufacturing.
How is a smart factory different from a regular automated factory?
Automation alone just executes fixed instructions. A smart factory adds a continuous feedback loop. Data from the process informs and adjusts decisions in near real time. SAP describes this progression well in their breakdown of smart factory concepts at sap.com/products/scm/what-is-a-smart-factory.html.
Do we need a huge budget to start using manufacturing data analytics?
No, and I’d actively discourage a huge upfront spend before you’ve proven a use case. Most of the plants I’ve worked with started with a handful of sensors on one problem line and a modest dashboard. They expanded once they had a documented win to point to.
Can data analytics actually prevent supply chain bottlenecks, or just detect them faster?
Both, depending on maturity. Early stage programs mostly detect problems faster, which still saves real money. More mature programs tie supplier, inventory, and production scheduling data together. That combination can predict a bottleneck days in advance and give planners time to act before it affects the line. NetSuite’s guide to smart factory maturity levels covers this progression at netsuite.com/portal/resource/articles/inventory-management/smart-factory.shtml.
What’s the biggest mistake plants make when adopting manufacturing data analytics?
Treating it purely as a technology purchase instead of an operational change. Buying sensors and a platform is the easy part. Getting operators, quality engineers, and planners to trust and use the resulting data is harder. That’s where most programs succeed or stall.
How long does it take to see real results?
In my experience, a well scoped pilot targeting one bottleneck or quality issue shows measurable results within one to two quarters. Broader plant wide transformation is a multi year effort. McKinsey’s research on Industry 4.0 adoption at scale backs up that longer timeline, and you can find it at mckinsey.com/capabilities/operations/our-insights/transforming-advanced-manufacturing-through-industry-4-0.
References
IBM. “Smart Manufacturing.” IBM Think. https://www.ibm.com/think/topics/smart-manufacturing
SAP. “What Is a Smart Factory? Benefits and Best Practices.” https://www.sap.com/products/scm/what-is-a-smart-factory.html
NetSuite. “What Is a Smart Factory? An Expert Guide.” https://www.netsuite.com/portal/resource/articles/inventory-management/smart-factory.shtml
McKinsey & Company. “Advanced Manufacturing and the Promise of Industry 4.0.” https://www.mckinsey.com/capabilities/operations/our-insights/transforming-advanced-manufacturing-through-industry-4-0
Oracle. “What is Smart Factory and Smart Manufacturing?” https://www.oracle.com/industrial-manufacturing/smart-factory-and-smart-manufacturing/