

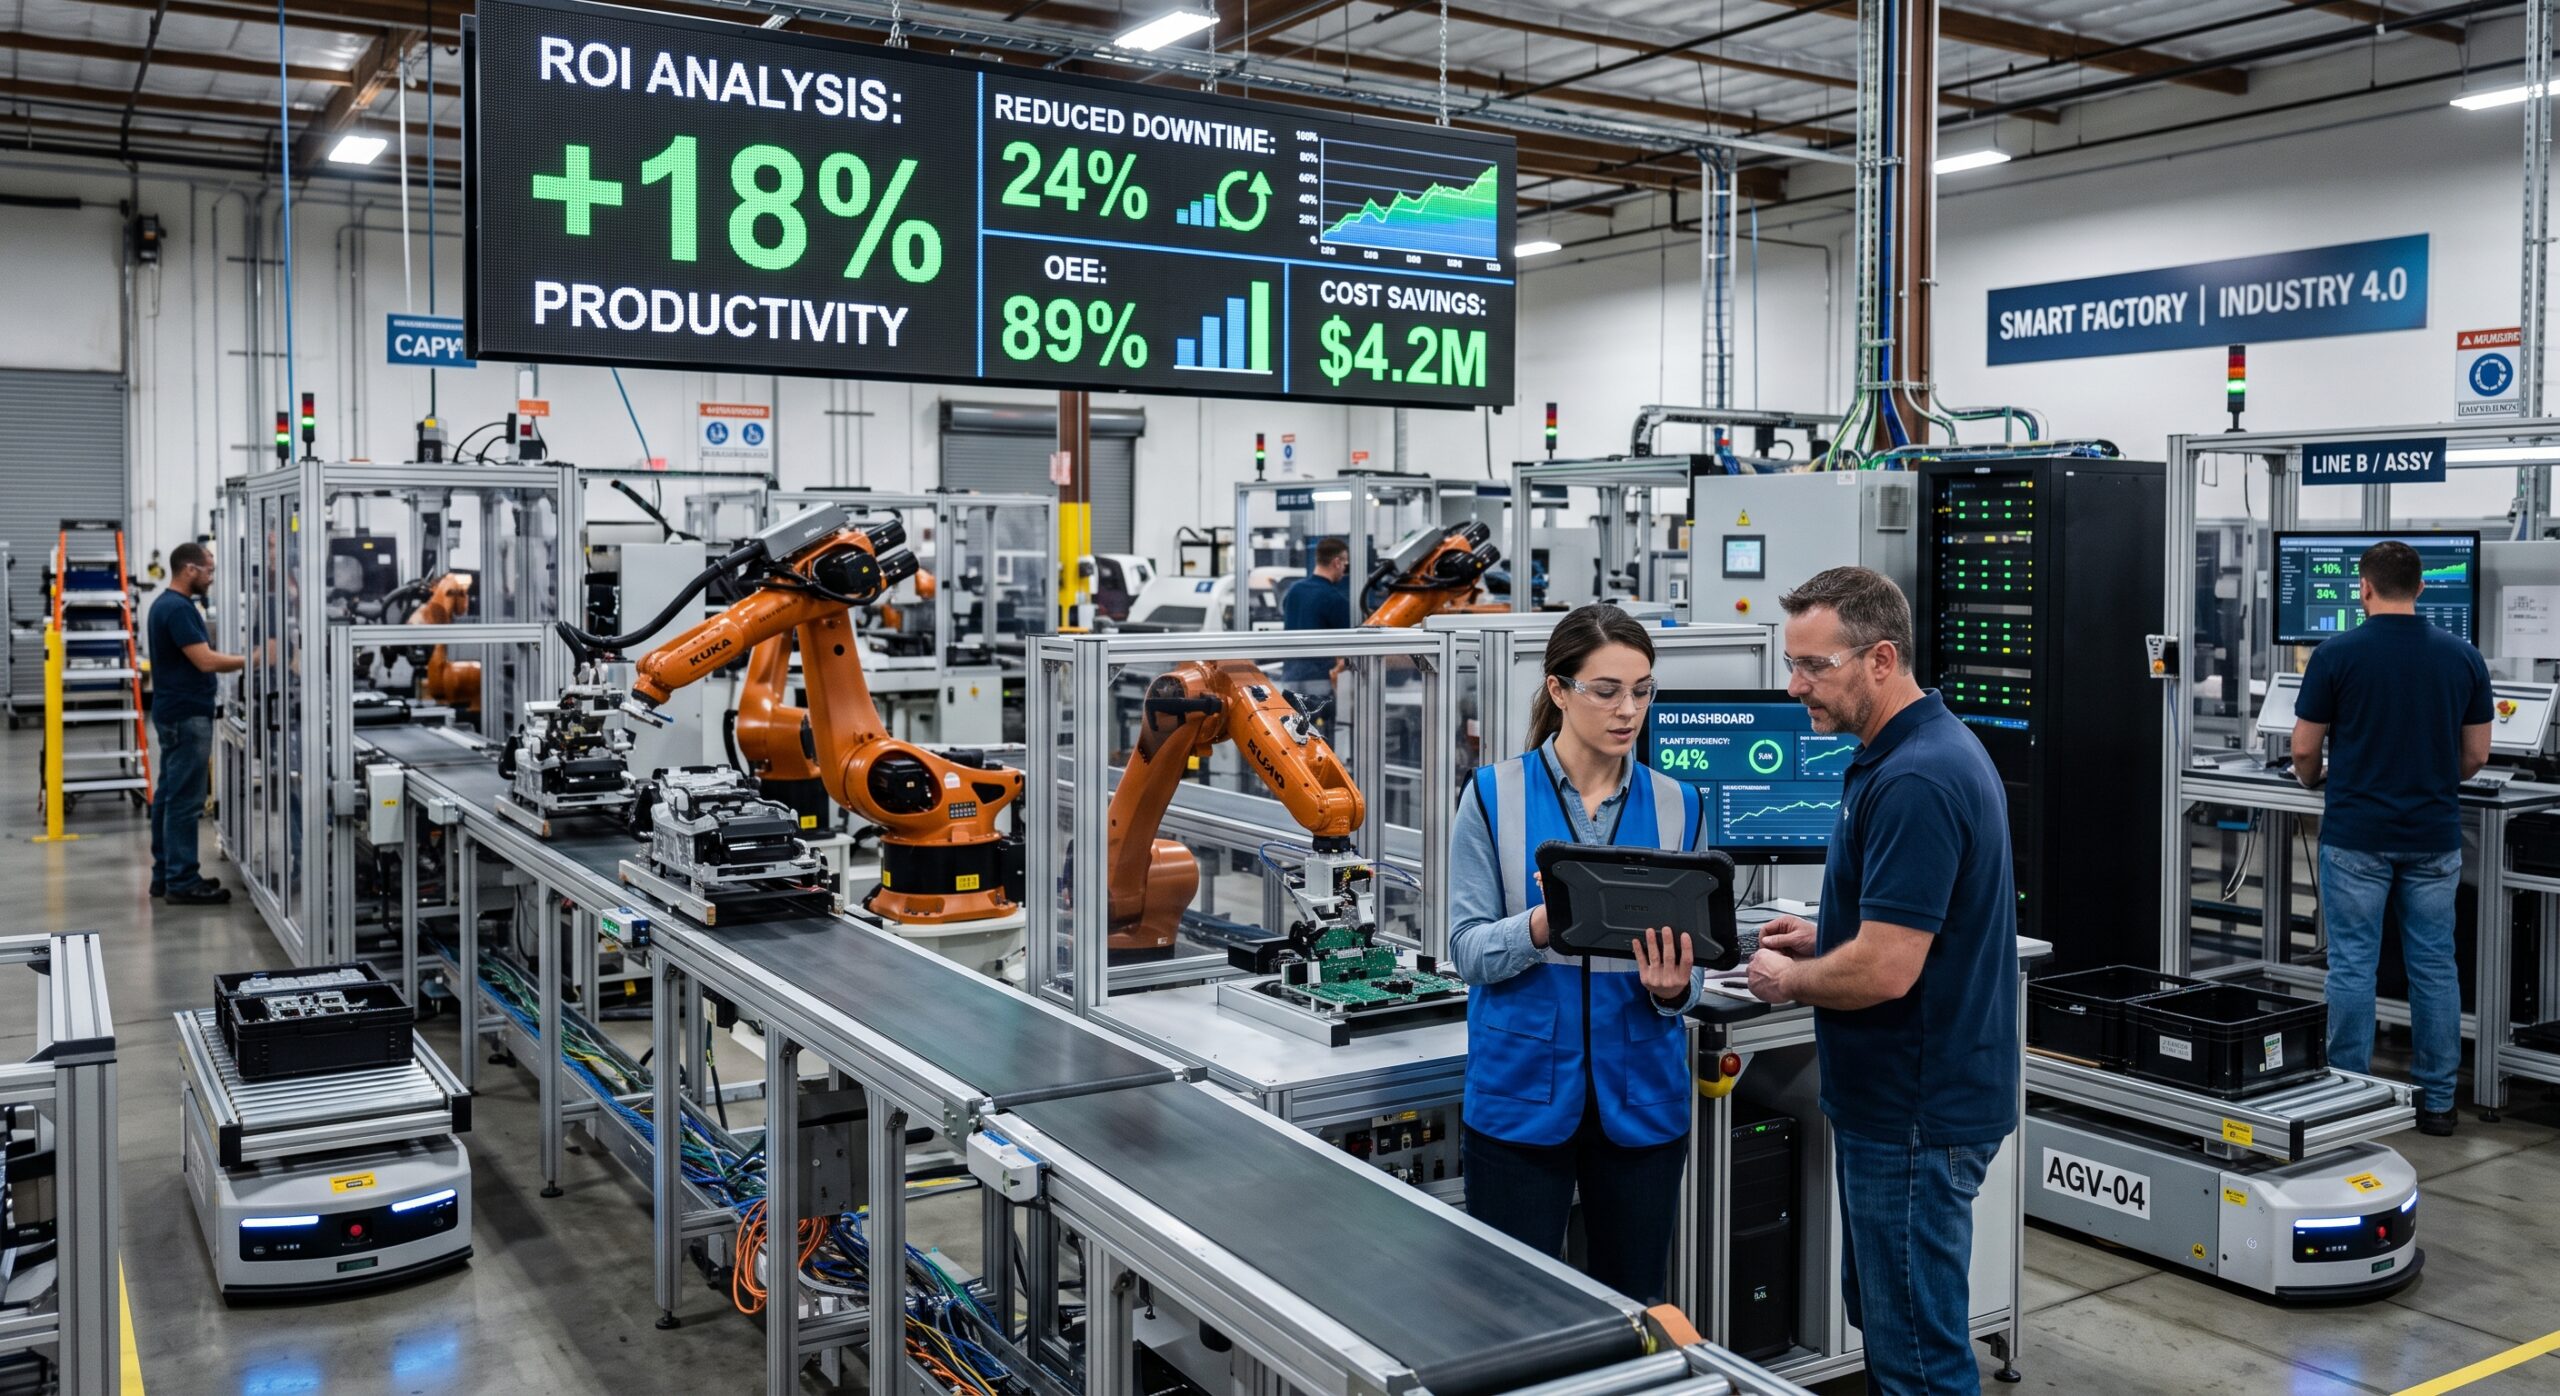
I have sat in more capital budget meetings than I can count. The pattern is always the same. Someone on the plant floor gets excited about sensors, dashboards, and predictive maintenance. Then finance asks a simple question that stops the whole room cold: where is the payback? If you cannot answer that question in plain numbers, your smart factory implementation stays a slide deck. It never becomes a funded project.
That question is fair. The global smart factory market was valued at roughly 141.5 billion dollars in 2024. It is expected to grow at a compound annual rate near 9.4 percent through the next decade, according to Grand View Research market data. Vendors are lining up to sell automation, analytics platforms, and connected sensors. But a purchase order is not a strategy. A dashboard is not a return. After twenty years advising manufacturers on operations and digital transformation, I have learned something simple. The companies that succeed at smart factory implementation are not the ones with the flashiest technology. They treat it like any other capital investment, with a real business case, disciplined cost tracking, and metrics tied directly to profit and loss.
This article walks through how to build that case. It covers where the real savings come from and how to measure whether your investment is working. No vague promises. Just the framework I use with clients before they sign a purchase order.
Why Financial Justification Gets Skipped, and Why That Backfires
Plant managers often pitch smart factory projects using operational language: better visibility, faster changeovers, fewer surprises. Those things matter. But a chief financial officer thinks in different terms. They want the total cost of ownership. They want the internal rate of return. Most of all, they want to know how long it takes to get the cash back.
The Manufacturing Enterprise Solutions Association, known as MESA International, has published guidance on exactly this gap for years. Their framework points manufacturers toward classic investment models such as net present value, total cost of ownership, internal rate of return, and return on assets. These are not exotic tools. They are the same models used to justify a new press line or a warehouse expansion. Most teams skip this step because the technology feels new and unfamiliar. They treat digital projects as if they live outside normal capital discipline. They do not.
When a project skips financial justification, three things tend to happen. First, the scope creeps, because nobody defined what success looks like in dollar terms. Second, the project competes poorly against other capital requests during the next budget cycle, because it cannot show hard numbers. Third, and this is the one that stings most, a project that actually delivered value gets killed anyway, because nobody tracked the savings well enough to prove it.
What This Looks Like in Practice
I worked with one operations director who described this pattern well. Her team had proven, real savings on a pilot cell. But nobody had documented the baseline before the project started. When the next budget cycle came around, she could point to a better-running line. She could not put a defensible number next to it. The project survived, barely, only because a plant manager vouched for it personally. That is not a sustainable way to fund a program. It is entirely avoidable with a little discipline up front.
Building the Business Case: Start With the Numbers Finance Already Trusts
If you want budget approval, speak the language of the people approving it. Here is the structure I use with operations leaders before they walk into a capital committee meeting.
Start with total cost of ownership. This includes hardware, software licensing, integration labor, training, and ongoing maintenance across a realistic time horizon. For manufacturing technology, that is usually five to seven years. Too many proposals only show the upfront capital number. They ignore the recurring costs of platform subscriptions, cybersecurity upkeep, and the internal staff time needed to keep systems running.
Next, calculate expected return using net present value and internal rate of return, not just a simple payback period. A simple payback calculation ignores the time value of money. It can make a project look better or worse than it really is. Finance teams trust NPV and IRR because those are the same tools used across the rest of the business.
Then quantify the savings by category, rather than as one lump figure. Break it into hard savings, the kind you can point to on an invoice or a labor report. Separate that from soft savings, the kind tied to quality improvements or reduced risk. Hard savings win budget approval faster, because they are easier to verify later.
Finally, build a sensitivity case. Show what happens if adoption is slower than planned, or if one production line underperforms. A business case that only shows the best outcome loses credibility the moment reality falls short of the plan. A business case that shows a realistic range earns trust. It signals that the team understands the risk, not just the upside.
Where the Real Cost Reduction Actually Comes From
This is the part most vendor pitches gloss over. Cost reduction in a smart factory implementation rarely comes from one big miracle system. It comes from several specific, well-documented levers. Research from CRB Group, an engineering and consulting firm working across pharmaceutical and industrial manufacturing, breaks these down clearly. I have seen the same pattern hold across the plants I have worked with.
Infrastructure and Cloud Savings
The first lever is replacing legacy, vendor-locked infrastructure with modern, open architecture. Manufacturers who move from proprietary data historians to open, cloud-native alternatives have reported savings above 50 percent on licensing costs alone. Maintenance costs drop too. That is real money on a software line item every single year, not a projection.
The second lever is cloud infrastructure. Moving operational technology workloads to the cloud, instead of buying and maintaining physical servers, can cut costs by as much as 60 percent for typical workloads. This matters most for growing operations. Otherwise they keep expanding server rooms and IT headcount just to keep pace.
Visibility, Data, and Energy Savings
The third lever is equipment visibility. You cannot fix what you cannot see. Digital monitoring across a production line often reveals a piece of equipment quietly running at reduced efficiency for months. One example from the CRB research showed a potential 10 percent efficiency gain on a fill-finish line. That gain delayed the need for a costly facility expansion entirely. I watched this exact scenario play out with a client who assumed they needed a second line. The data showed their existing line was underperforming by nearly that same margin.
The fourth lever is data governance. It sounds unglamorous, but it is often the biggest hidden cost. Data scientists and engineers can spend up to 80 percent of their time simply cleaning and organizing data, according to the same research. A structured data governance strategy, built early, frees that time for actual predictive maintenance and process improvement work.
There is a fifth category worth naming separately: energy. One biostorage facility profiled in that same research achieved a 60 percent reduction in energy use through smarter monitoring and controls. That saved roughly 500,000 dollars annually. Energy costs rarely top the list when people first imagine a smart factory implementation. For energy-intensive operations, this can be one of the fastest paybacks available.
A Realistic Scenario From the Plant Floor
I want to describe a pattern I have seen repeatedly, not a single named case study. The shape of this story repeats across industries, from food processing to industrial components.
A mid-size manufacturer running three shifts decides to pilot a smart factory implementation on one production line before rolling it out plant-wide. They start with equipment sensors and a basic analytics dashboard, budgeted with a clear total cost of ownership over five years. Within the first 12 months, the pilot line identifies a bottleneck that had quietly limited output for over a year. Fixing it, without buying new equipment, recovers enough capacity that the company delays a planned facility expansion. Maintenance costs on that line drop, because technicians shift from reactive repairs to scheduled interventions based on real equipment condition. Scrap rate improves too, because operators can see quality drift in real time instead of finding it during final inspection.
None of that required a full plant overhaul. It required a scoped pilot, clean financial tracking, and a willingness to measure results honestly, including the parts that did not go as planned. That is the difference between a smart factory implementation that earns its next budget cycle and one that gets quietly shelved.
Measuring Success: The Metrics That Actually Matter
Here is where many projects lose momentum after the first year. Leadership approved the investment based on projected savings. But nobody set up a consistent way to track whether those savings actually materialized. Research from iBase-t on digital transformation metrics makes a useful point. The metrics that matter early in a smart factory implementation are different from the ones that matter once the technology matures.
From Adoption Metrics to Performance Metrics
Early on, focus on adoption metrics. Track the percentage of manual data entry that has been eliminated. Track the share of reporting that is now automated, and how many roles are actually using the new tools day to day. If adoption is low, no amount of technology will produce savings. The old manual workarounds are still running in parallel.
As the program matures, shift toward performance metrics that connect to the bottom line. Overall Equipment Effectiveness and First Pass Yield remain the backbone of manufacturing performance measurement, but their role changes. In a well-run digital plant, these numbers stop being the improvement target. They start acting more like an alarm threshold, flagging when something has gone wrong rather than showing ongoing gains. Once a line is running near its practical ceiling, the interesting metrics shift. Watch engineering change cycle time, how quickly a plant responds to a predictive maintenance alert, and how well the operation handles additional product variants without adding headcount.
How Many Metrics Is Enough
I generally recommend clients settle on a small, fixed set of tracked indicators, rather than a sprawling dashboard nobody checks. In practice, that tends to land around 12 core metrics spanning cost, quality, throughput, and workforce adoption. Fewer than that and you miss warning signs. More than that and the leadership team stops paying attention.
Industry surveys back up how much this discipline matters. A recent Manufacturing Leadership Council survey found that more than 90 percent of manufacturers plan to maintain or increase smart factory investment going forward. Yet only about a third rate their own operations at the highest maturity level. The gap between investment and maturity usually is not a technology problem. It is a measurement problem. Companies keep spending because leadership believes in the direction, even while internal tracking fails to prove out the specific returns.
Common Pitfalls That Erase the Business Case
A few mistakes show up again and again. They are worth naming plainly.
Treating the project as an IT initiative instead of an operations initiative. When plant leadership is not driving the priorities, the technology ends up solving problems nobody on the floor actually has.
Ignoring the workforce side of the equation. The same Manufacturing Leadership Council survey found that a lack of skilled employees remains one of the top obstacles to progress, alongside legacy equipment and data interoperability issues. Training budgets deserve the same rigor as software budgets.
Chasing a single large deployment instead of a scoped pilot. Big-bang rollouts are harder to justify financially. They are also harder to course-correct when something does not work as expected.
Losing track of soft costs. Integration labor, change management, and the time staff need to learn new workflows rarely make it into the original business case. Later, they show up as unexplained cost overruns that undermine confidence in the whole program.
Failing to revisit the business case after go-live. The numbers used to justify the project should get checked against actual results at defined intervals. Do not file the business case away and forget it the day the system goes live.
Getting Finance, IT, and Operations Talking the Same Language
One habit separates the smart factory implementation projects that survive their second budget cycle from the ones that quietly disappear. The successful ones get finance, IT, and plant operations aligned before the first dollar is spent, not after something breaks.
Finance wants disciplined return modeling and clear visibility into ongoing costs, not just the upfront capital number. IT wants to know how a new platform fits into existing security policy, network architecture, and support obligations. A system that operations loves but IT cannot maintain becomes a liability within a year. Operations wants tools that solve a real problem on the floor. Nobody on the floor wants a system that looks impressive in a boardroom demo but adds extra steps to a shift.
When these three groups build the business case together, the resulting plan tends to be more conservative and more accurate at the same time. Finance catches costs that operations would have missed. IT flags integration risk before it becomes a change order. Operations keeps the whole project honest about what will actually get used on the floor. I have watched projects with strong technology but weak cross-functional buy-in fail within eighteen months. I have also watched modest, well-aligned pilots grow into plant-wide programs, specifically because every stakeholder trusted the numbers from day one.
This is also where vendor selection discipline matters. It is tempting to buy a platform because it offers the most features. But the platform that wins should be the one that solves your specific bottleneck at a total cost of ownership you can defend in front of a capital committee. A system with fifty capabilities you will never use is not a bargain, even at a discount.
Building Your Roadmap
For manufacturers just starting this journey, I recommend a straightforward sequence. Pick one production line or process area with a clear, measurable pain point, not the whole plant. Build the total cost of ownership and return model before any equipment is ordered. Define your tracked metrics in advance, including a baseline measurement before the project starts. You cannot show improvement without knowing where you began. Run the pilot for a defined period, typically six to twelve months, and report results honestly, including what underperformed. Only then expand. Use the pilot’s actual financial results, not the original projections, to justify the next phase.
This approach is slower than a plant-wide rollout, and that is precisely the point. A disciplined, well-measured pilot builds the internal credibility needed to fund the next phase, and the phase after that.
Final Thoughts
Smart factory implementation is not a technology decision. It is a capital allocation decision that happens to involve technology. The manufacturers who get real value out of it apply the same financial discipline they would apply to any other major investment: clear cost accounting, realistic return modeling, and consistent measurement after the money is spent. Do that well, and the numbers speak for themselves at the next budget review. Nobody needs to sell the vision all over again.
Frequently Asked Questions
What is the typical payback period for a smart factory implementation?
Payback varies widely by scope and industry. Well-scoped pilots often show measurable returns within 12 to 18 months, particularly when the project targets a known bottleneck or a high energy cost area. Broader plant-wide rollouts usually take longer to fully pay back. That is one reason a phased approach tends to perform better financially. More detail on justification timelines is available from MESA International.
What financial metrics should I use to justify a smart factory project?
Total cost of ownership, net present value, internal rate of return, and return on assets are the standard tools finance teams already trust. Using them keeps a digital transformation proposal on equal footing with any other capital request. Background on applying these models to manufacturing IT is available from MESA International.
Where do the biggest cost savings usually come from?
In most engagements, the largest savings come from replacing legacy licensed infrastructure, moving suitable workloads to the cloud, improving visibility into underperforming equipment, and reducing the time engineers spend cleaning and preparing data. Energy efficiency gains can also be substantial in energy-intensive operations. A detailed breakdown of these categories is available from CRB Group.
How many metrics should a manufacturer track to measure success?
There is no fixed rule, but a focused set, often around a dozen indicators covering cost, quality, throughput, and adoption, tends to work better than a sprawling dashboard. Guidance on how these metrics should evolve as a program matures is available from iBase-t.
Is a full plant rollout better than a pilot program?
For most manufacturers, no. A scoped pilot on one line or process area allows for a cleaner financial case and faster course correction. It also builds stronger internal credibility once results are proven, which then supports funding for a wider rollout.
What is holding back manufacturers from reaching full smart factory maturity?
Recent survey data points to legacy equipment, data interoperability challenges, and a shortage of skilled employees as the leading obstacles, more so than a lack of available technology. Full survey results are available from the Manufacturing Leadership Council.
References
CRB Group. 4 Ways to Reduce Costs With Industry 4.0. https://www.crbgroup.com/insights/consulting/reduce-costs-industry-40
iBase-t. Use Emerging Industry 4.0 Metrics to Measure Digital Transformation Success. https://www.ibaset.com/emerging-industry-4-0-metrics-to-measure-digital-transformation-success/
Manufacturing Leadership Council. Survey: Smart Factories Enter the Execution Era. https://manufacturingleadershipcouncil.com/survey-smart-factories-enter-the-execution-era/
Grand View Research (GMI). Smart Factory Market Size, Share and Forecast Report, 2025 to 2034. https://www.gminsights.com/industry-analysis/smart-factory-market