Every manufacturing floor has its own distinct rhythm. That steady hum of mechanical movement signals profitable operations, and tracking precise maintenance performance metrics is the best way to keep that hum consistent. As a Maintenance and Reliability Engineering Manager, I have spent decades listening to that music. I have also heard what happens when it grinds to a sudden, costly halt. In our industry, it is easy to get caught up in daily firefights. We constantly chase broken belts, blown fuses, and emergency service calls. However, we never achieve true operational excellence by merely reacting to the crisis of the hour. Real success lies directly in the data. We must leverage structured insights to transform our floor from a reactive cost center into a proactive driver of profitability.
When we look closely at our operations through the lens of the Industrial Maintenance Management Guide, our core mission simplifies into three major targets. We must maximize throughput, reduce production cycle time, and minimize our scrap rate. If an engineering strategy does not directly impact these three pillars, it is simply a distraction.
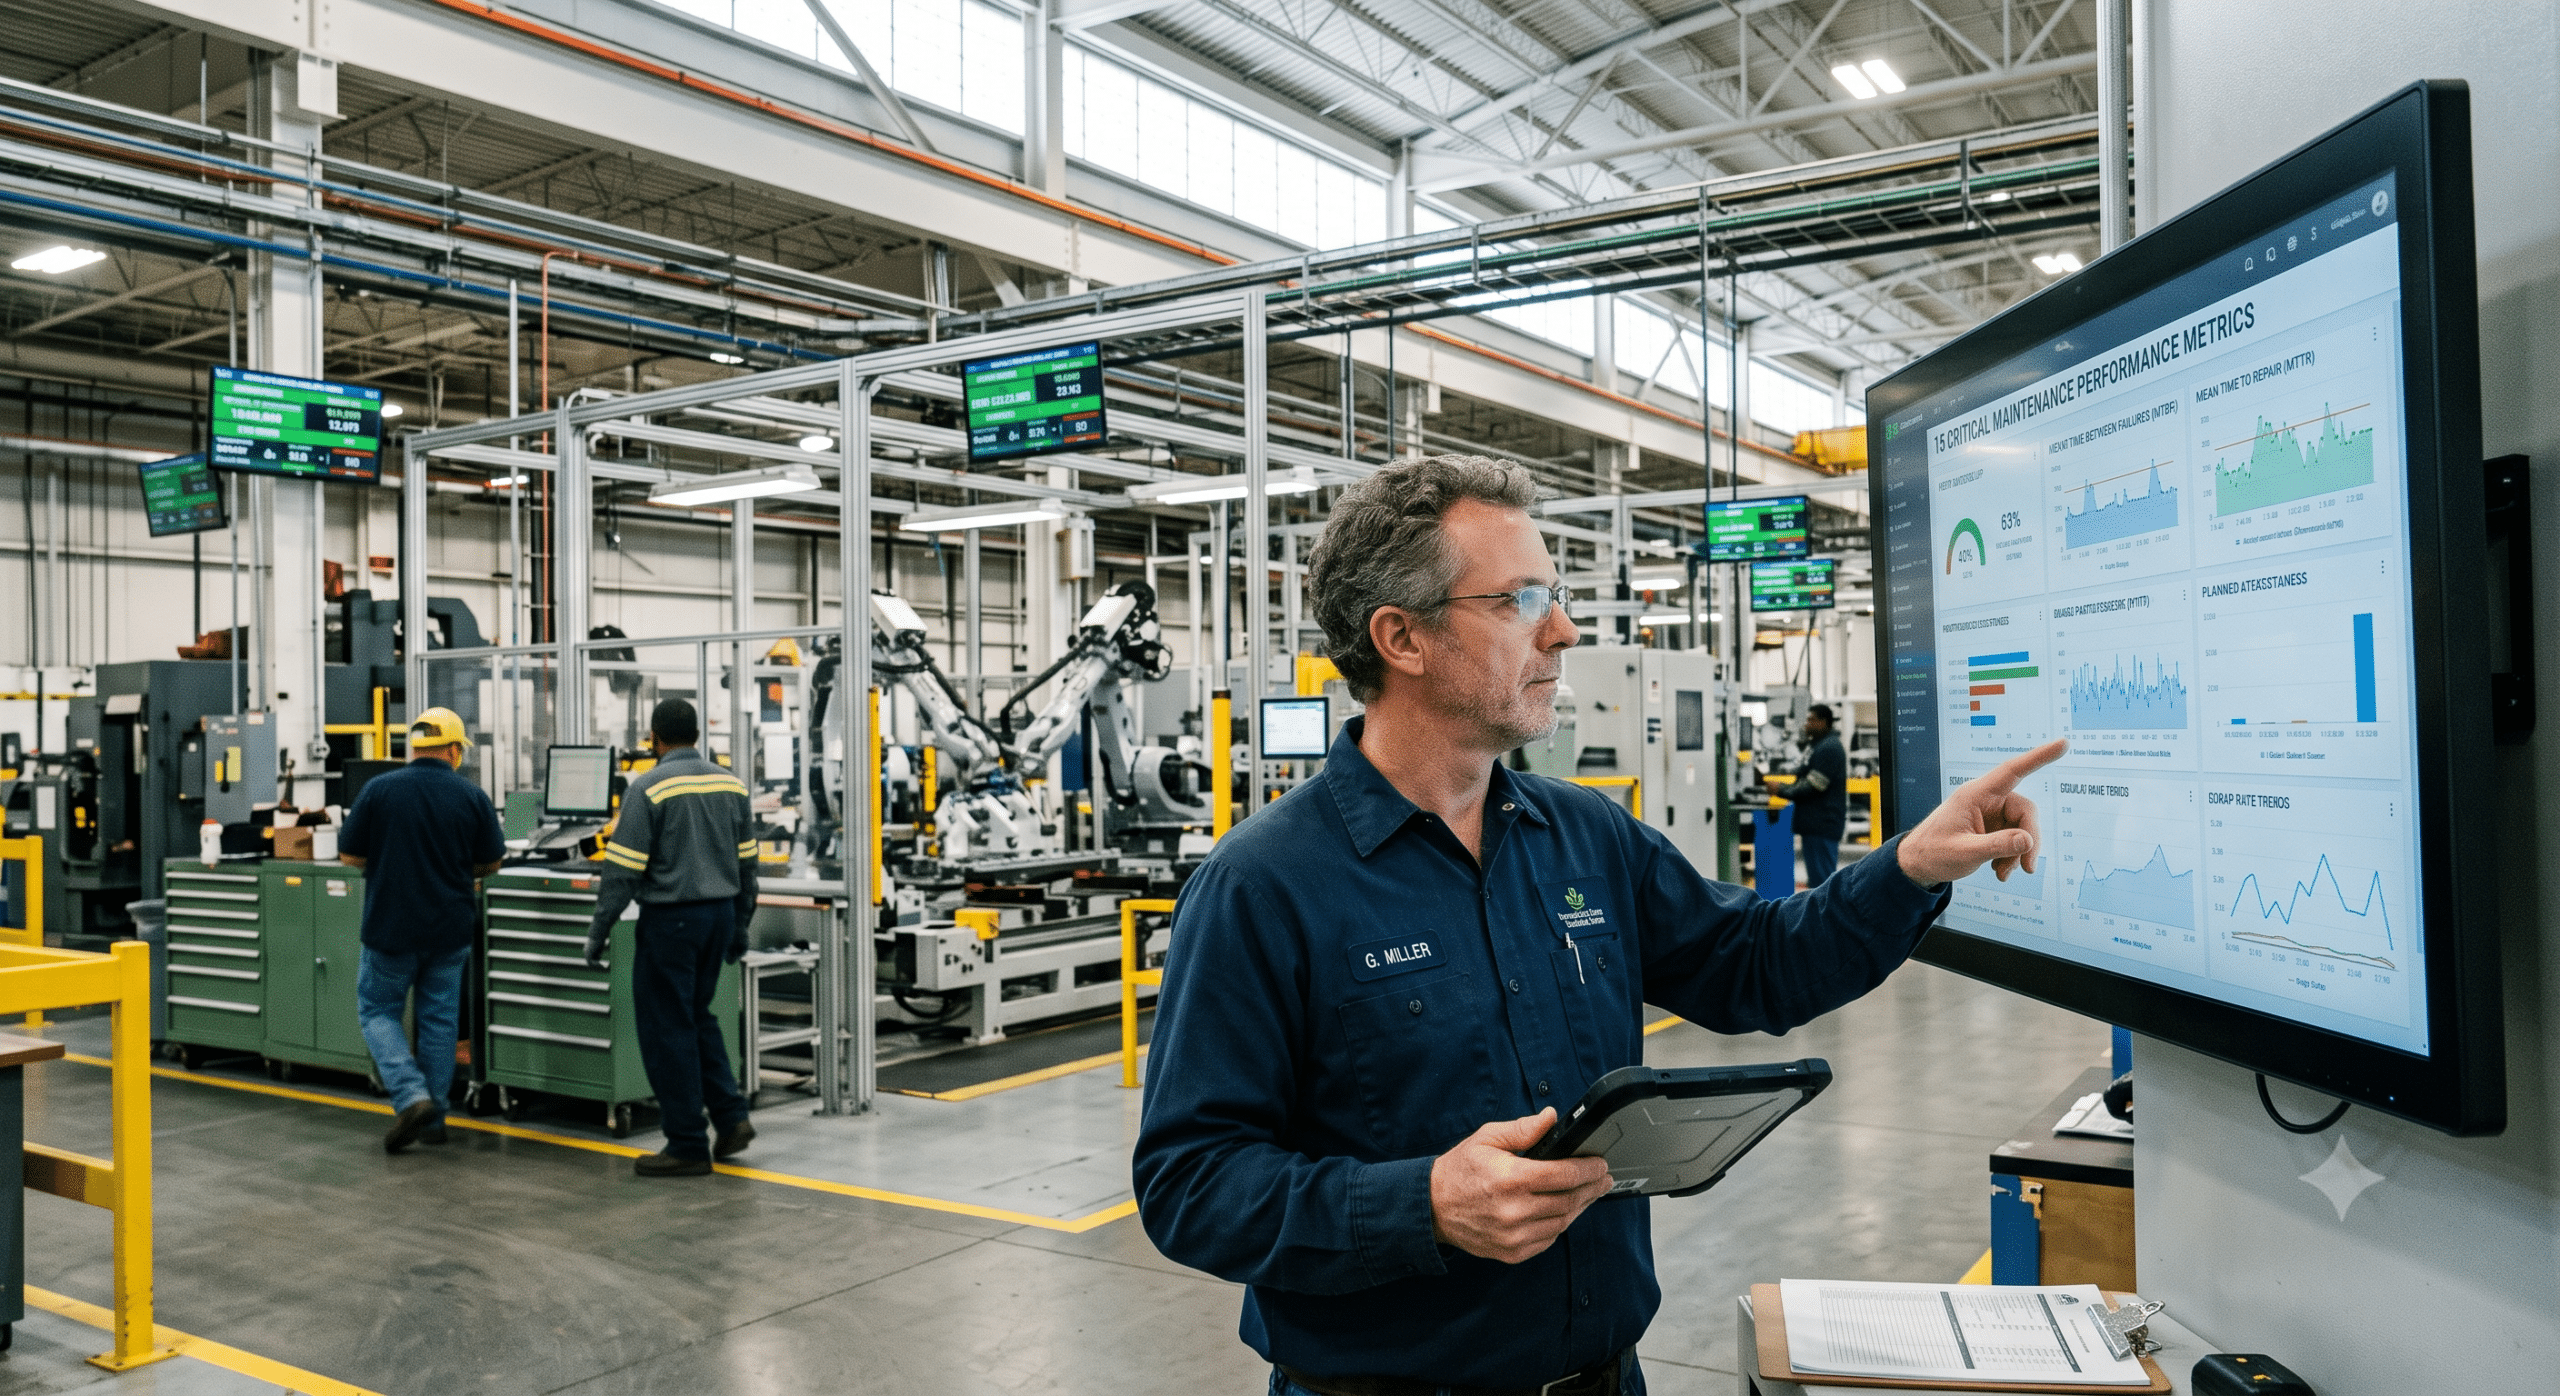
To help our teams shift from chaotic firefighting to high-precision reliability, I have mapped out 15 vital frameworks. They center entirely on modern maintenance performance metrics. These benchmarks are not just numbers to file away in a spreadsheet at the end of the month. Instead, they represent the operational pulse of our entire plant. They serve as the strategic playbook required to keep our production lines moving faster, running cleaner, and delivering exceptional value.
1. The Operational Alignment of Production Flow
To build a high-performance production facility, we must establish a unified alignment between our engineering personnel and our daily operations staff. When a critical piece of machinery goes down, the gap between detecting the initial issue and executing the final repair directly impacts plant throughput. If our floor technicians work with siloed data, the entire factory floor slows down. This delay inherently compromises our delivery timelines.
By using comprehensive maintenance performance metrics to analyze these operational gaps, we can pinpoint precisely where our communication channels fail. This analytical approach ensures that every single team member understands the big picture. They see how a minor mechanical adjustment prevents a massive bottleneck later in the production line.
2. Optimizing Asset Availability to Boost Throughput
Throughput is the lifeblood of our manufacturing ecosystem. It depends heavily on the constant availability of our primary assets. When we track asset availability, we look at the actual percentage of time our machinery is capable of running. We compare this to its fully scheduled runtime. If a critical packaging line sits idle due to an unexpected mechanical failure, our overall throughput drops immediately. This creates an expensive backlog that ripples across the entire warehouse.
By focusing our engineering resources on maximizing availability, we ensure that our automated systems are always ready to execute when production demands increase. This steady state of operational readiness allows our lines to run at their peak designed speeds without fear of sudden breakdowns.
3. Minimizing Mean Time to Repair to Cut Cycle Time
Cycle time measures how long it takes for a raw material to transform into a completed, sellable product. When an unexpected breakdown occurs, our cycle time stretches out dramatically and destroys our delivery schedules. This is where tracking Mean Time to Repair, or MTTR, becomes incredibly valuable. MTTR quantifies the average time our team takes to troubleshoot, fix, and restart an asset after an unexpected stoppage occurs.
By analyzing our MTTR data, we can determine whether our technicians possess the right diagnostic tools, documentation, and training to resolve issues quickly. Reducing our average repair times by even a few minutes directly shortens our overall cycle times. This improvement allows products to move through our production cells with minimal disruption.
4. Elevating Mean Time Between Failures for Plant Stability
Repairing machines quickly is important, but preventing those machines from breaking down in the first place remains our ultimate goal. Mean Time Between Failures, or MTBF, measures the average operational lifespan of a repairable asset between its sequential mechanical breakdowns. A low MTBF indicates that we are dealing with chronic, underlying issues that cause our machinery to fail repeatedly.
When we actively monitor and improve our MTBF, we stretch out the periods of continuous production. This extension directly increases our plant throughput. Ensuring that our machinery can run for hundreds of hours without requiring a single emergency intervention allows our operations team to maintain a smooth, predictable flow.
5. Controlling the Precision Calibration of Machinery
Subtle mechanical deviations, rather than catastrophic equipment failures, often cause high scrap rates. If a high-speed cutting tool or a robotic welding arm slips out of its precise alignment by a fraction of a millimeter, it will produce thousands of defective components before an operator notices the error. This is why we must monitor strict calibration schedules as a core part of our maintenance performance metrics.
By tracking our calibration compliance, we ensure that every machine operates within its exact engineering tolerances. This proactive mechanical precision keeps our scrap rate remarkably low. Ultimately, it saves thousands of dollars in wasted raw materials every single week.
6. The Role of Planned Maintenance Percentage
Operating in a purely reactive environment is one of the most expensive ways to run a factory floor. The Planned Maintenance Percentage, or PMP, measures how much of our total labor hours we dedicate to scheduled, proactive tasks compared to emergency, reactive repairs. Industry standards dictate that a world-class facility should maintain a PMP above eighty percent.
When we plan the majority of our work in advance, we can execute tasks during scheduled production windows. This protects our cycle times from sudden spikes. Furthermore, well-planned maintenance allows our technicians to inspect components thoroughly, preventing the mechanical wear that often leads to high scrap rates.
7. Streamlining Spare Parts Inventory Turnover
A poorly managed parts cage can easily derail a brilliant maintenance strategy. If a technician diagnoses a faulty sensor in ten minutes but waits four hours for a replacement part to arrive, our cycle time suffers terribly. Tracking our inventory turnover rates allows us to strike the perfect balance. We can keep essential spares on hand while avoiding excessive overhead costs.
By aligning our spare parts inventory with our historical failure data, we ensure that the exact component required for a critical fix always sits within arm’s reach. This logistical efficiency minimizes our total downtime and keeps our throughput targets securely on track.
8. Implementing Condition-Based Monitoring Systems
Waiting for a machine to break down introduces unwanted inefficiencies to the floor. Relying solely on a calendar schedule can do the same. Condition-based monitoring uses advanced sensors to track real-time variables like vibration, temperature, and acoustic signatures. By analyzing these data streams, our team can identify the early warning signs of component fatigue long before a failure occurs.
This gives us the unique ability to schedule a repair during a natural shift change, completely preserving our production cycle time. Catching these micro-faults early also prevents the sudden machine erraticisms that cause massive spikes in our scrap rate.
9. Maximizing Overall Equipment Effectiveness
Overall Equipment Effectiveness, or OEE, represents the ultimate metric for evaluating a manufacturing operation. It perfectly combines availability, performance, and quality into a single percentage. If our availability is high but our machines run at a reduced speed, our performance score drops. This indicates a bottleneck that slows down our cycle time.
If our machines run fast but produce defective parts, our quality score drops, which directly increases our scrap rate. By using OEE as a foundational maintenance metric, we gain a clear view of how our engineering practices affect the entire production system. This visibility allows us to make highly informed operational adjustments.
10. Eradicating Micro-Stoppages on High-Speed Lines
Micro-stoppages are those frustrating, brief pauses where a conveyor jams for thirty seconds or a sensor misreads a label and halts a line for a minute. Because these incidents are short, operators rarely record them on manual maintenance logs. Yet, they can easily add up to hours of lost production time over a single week.
These hidden disruptions quietly erode our plant throughput and lengthen our cycle times. By utilizing automated tracking within our maintenance performance metrics, we can identify these frequent micro-stoppages. We can then apply permanent engineering fixes to eliminate them entirely.
11. Tracking Schedule Compliance for Long-Term Success
Creating a beautiful preventive maintenance schedule means nothing if our team only completes half of the assigned tasks due to constant emergency interruptions. Schedule compliance tracks the percentage of scheduled work orders that technicians actually complete within their designated timeframes.
Maintaining high schedule compliance ensures that our assets receive the consistent care they need to operate reliably. This discipline keeps our throughput stable and our scrap rates exceptionally low. When our schedule compliance drops, it creates a dangerous backlog of uncompleted tasks. This neglect inevitably leads to catastrophic equipment failures down the road.
12. Optimizing the Maintenance Backlog Dynamic
Our maintenance backlog represents the total volume of essential work that we have identified but not yet completed. We measure this metric in total labor hours. A backlog that is too short might indicate that we overstaff our team. It can also mean we are failing to catch underlying issues during our regular inspections.
Conversely, a backlog that is too long indicates that our assets are deteriorating faster than we can repair them. This condition poses a serious threat to our cycle times. By carefully balancing our backlog dynamic, we can allocate our engineering resources effectively. We ensure that we perform critical machinery updates before they can negatively impact our production output.
13. Root Cause Analysis and Scrap Rate Reduction
When a machine fails and creates a huge pile of scrap material, our primary objective must extend beyond simply swapping out the broken part. We must conduct a formal Root Cause Analysis, or RCA, to understand exactly why the component failed in that specific manner.
If a bearing failed due to improper lubrication, simply replacing the bearing will ensure another failure occurs a month later. By identifying the root cause, such as an incorrect grease type or a blocked lubrication line, we can implement a permanent fix. This technical discipline protects our machinery from erratic behavior, which dramatically reduces our scrap rates and keeps our throughput high.
14. Enhancing Vendor and Contractor Efficiency
In many modern industrial facilities, external contractors or original equipment manufacturers execute a significant portion of specialized maintenance work. If these external technicians take twice as long as expected to complete a major machine overhaul, our cycle time increases significantly.
Therefore, our maintenance performance metrics must also track vendor efficiency. We look closely at their response times and their first-time fix rates. Holding our external partners to the same rigorous data standards as our internal team ensures that we complete major project shutdowns on time. This accountability allows us to resume full-scale production without unnecessary delays.
15. Standardizing Workflow Procedures for Reliability
The final framework relies on the absolute standardization of our maintenance procedures across every shift. If Technician A calibrates a machine using one method on Monday, and Technician B uses a completely different approach on Tuesday, the machine will behave unpredictably. This operational variance introduces hidden instabilities that can slow down cycle times and create unexpected defects.
By building clear, digitized checklists within our asset management platform, we guarantee that our team performs every task exactly the same way every time. This rigorous consistency creates a predictable manufacturing environment where throughput flourishes, cycle times drop, and scrap rates disappear. Ultimately, utilizing standardized data remains the best way to extract value from your maintenance performance metrics.
Frequently Asked Questions
What is the most effective way to start tracking maintenance performance metrics if our facility currently relies on manual logs?
The most effective approach is to implement a centralized, digital computerized maintenance management system. This system allows technicians to log work orders on mobile devices directly from the factory floor. Starting with just two or three critical metrics, such as downtime duration and schedule compliance, will help build a strong data collection culture before expanding to more complex analytics.
How does reducing maintenance response times directly impact our factory scrap rate?
When a machine begins to drift out of calibration or experiences a minor component malfunction, it often continues to run while producing sub-standard products. A fast maintenance response time ensures that we pause or correct the line immediately. This stops the creation of defective items and saves valuable raw materials.
Can a high planned maintenance percentage actually slow down our plant throughput?
If we poorly schedule or over-perform preventive tasks, they can introduce unnecessary downtime that limits total output. However, when we base proactive maintenance on data and align it with natural production breaks, it prevents catastrophic breakdowns. This results in a net increase in long-term throughput.
Why do engineering teams consider Mean Time Between Failures a lagging indicator of machine health?
We calculate MTBF using historical failure data, meaning it tells you how reliably your equipment performed in the past. To balance this lagging indicator, teams should use leading indicators like predictive maintenance alert compliance to fix issues before an official breakdown occurs.
References for Further Reading
For a deeper exploration of advanced reliability strategies and industrial metrics tracking, consider reviewing the comprehensive industry analysis found in the eMaint Maintenance Metrics Guide. This resource highlights how the integration of digital asset management platforms drives modern high-throughput manufacturing facilities.