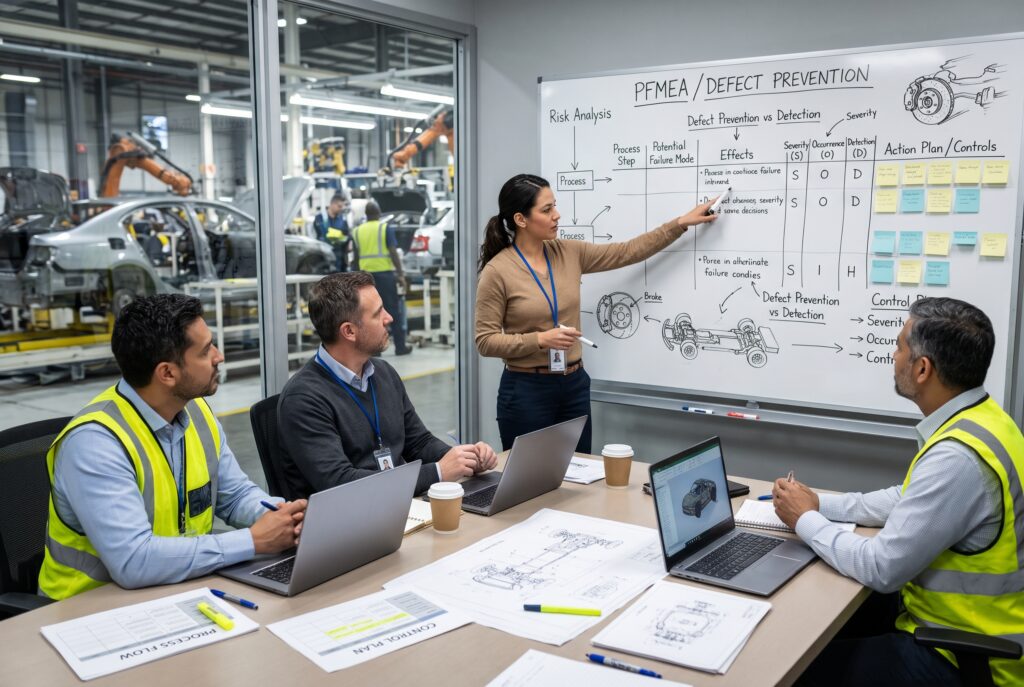
Quality engineers use PFMEA to identify manufacturing risks, evaluate potential failures, and develop controls to prevent defects.
The first PFMEA I ever audited as a supplier quality engineer ran 47 pages, used color coding throughout, and carried six signatures. It looked great. However, two weeks later, that same plant shipped a batch of brake line brackets with a missing weld nut. In fact, the failure mode sat right there in the document, on row 112, with an occurrence rating of 2 and a detection control that said “operator visual check.” No one had looked at that row since the PPAP approval.
That experience changed how I look at every PFMEA I touch. After all, a PFMEA that sits in a shared drive folder and only comes out for audits isn’t a risk tool. Instead, it’s a record of what a team thought might go wrong three years ago, before the second shift started, before maintenance rebuilt the fixture, and before purchasing switched resin suppliers to save four cents a part.
I’ve spent most of my career in automotive quality: supplier development, launch support, customer complaint firefighting, and more IATF surveillance audits than I’d like to count. So this article is what I wish someone had handed me in my first year. It isn’t a summary of the handbook. Rather, it’s how to build a PFMEA that a plant actually uses to keep defects off the truck.
What a PFMEA Is Really For
On paper, a Process Failure Mode and Effects Analysis is a structured way to find out how a manufacturing or assembly process could fail, what that failure would do to the customer, and what you’re doing to stop it. For example, the American Society for Quality describes FMEA as a systematic, step by step approach to identifying and prioritizing possible failures in a design, process, product, or service. It also notes that the method traces back to the U.S. military in the 1940s.
In practice, though, a good PFMEA does three jobs at once:
- First, it forces a cross functional team to think through the process before parts start running, when changes are still cheap.
- Second, it becomes the source of truth for the control plan, the work instructions, and the error proofing list.
- Finally, it turns into a living memory of the line, so that what you learned from last year’s scrap and complaints doesn’t disappear when people change roles.
If your PFMEA isn’t doing all three, then it’s just paperwork. And paperwork doesn’t stop a missing weld nut.
The PFMEA Framework You’re Expected to Follow Now
For years, most North American suppliers worked from the AIAG FMEA 4th Edition, while German OEMs leaned on VDA Volume 4. As a result, suppliers shipping to both faced real headaches. The fix arrived in June 2019, when AIAG and VDA published a harmonized handbook. According to the AIAG FMEA page, GM, Ford, Stellantis, Honda North America, BMW, Volkswagen Group, Mercedes, and Daimler Truck now all accept it.
The biggest structural change is the seven step approach. As both Quality Digest’s breakdown of the AIAG and VDA process and the Quality Training Portal’s PFMEA resource lay out, the steps are:
- Planning and Preparation
- Structure Analysis
- Function Analysis
- Failure Analysis
- Risk Analysis
- Optimization
- Results Documentation
The Quality Training Portal also groups them into three phases. Steps 1 to 3 cover system analysis, steps 4 to 6 cover failure analysis and risk mitigation, and step 7 covers communication. I like that grouping because it shows where most teams cut corners. Typically, they rush through the system analysis so they can get to the “real work” of filling in ratings. That’s backwards, because the quality of your ratings depends almost entirely on how well you did the first three steps.
So let’s go through them the way I’d coach a launch team.
Step 1: PFMEA Planning and Preparation
The handbook calls this step the 5Ts: InTent, Timing, Team, Tasks, and Tools. It sounds like admin work. In reality, this is where most PFMEAs quietly fail.
Define the PFMEA Scope Like You Mean It
“Front door assembly line” is not a scope. By contrast, “Operations 10 through 80 on Line 4, front door inner panel subassembly, from receiving of stamped panels through end of line leak test, excluding paint” is a scope. When the boundaries stay fuzzy, interface failures fall through the cracks. Moreover, interfaces, such as the handoff between stamping and welding or between your dock and the customer’s, account for a large share of real escapes.
Build the Right PFMEA Team
When a quality engineer builds a PFMEA alone at a desk, it will miss half the failure causes. Instead, you need the process engineer who designed the fixture, a maintenance tech who knows which clamps wear out first, and a line lead who has actually run the station on a Sunday night with a temp operator. You also need someone from design who can explain why that characteristic matters. On one launch, for instance, a material handler told us the team stacked bins four high in the staging area, crushing the bottom layer’s locating tabs. No engineer on the team had ever walked that aisle.
Pull Your History First
Before the first meeting, gather the customer complaints, warranty returns, internal scrap Pareto, and lessons learned from similar parts. Likewise, if you have a foundation or family PFMEA for that process type, start there. After all, you shouldn’t rediscover the same failure modes from scratch on every program.
Step 2: PFMEA Structure Analysis
This is where you break the process into its elements. Specifically, the AIAG and VDA approach uses three levels: the process item (the overall process or the product it makes), the process steps (each operation), and the process work elements beneath each step.
Teams usually sort those work elements using the 4M categories: Man, Machine, Material, and Environment, and some teams add Method and Measurement. In my view, this step separates a strong PFMEA from a template copy. For example, when you list the work elements for a torque operation as “operator, nutrunner, fastener, fixture, controller software, ambient conditions,” you’ve already given yourself a checklist of where causes can come from.
A process flow diagram serves as the input here, and therefore it has to match the floor. I always do a walk with the process flow in hand before signing off on structure. If there’s a rework loop, an offline inspection bench, or a “temporary” manual operation that’s been running for eight months, it goes in the structure. Auditors love finding unlisted rework stations, and frankly, they’re right to.
Step 3: Function Analysis
For each element, you define what it’s supposed to do and the requirement it has to meet. For instance, “torque fastener” is a function. Meanwhile, “torque M8 fastener to 25 Nm ±2 Nm with angle monitoring” is a function with a requirement.
This step is also where special characteristics from the DFMEA flow down. If design flagged a characteristic as safety or regulatory critical, it has to show up here, linked to the process step that creates or affects it. So when I review a PFMEA and can’t trace a critical characteristic from the drawing to a specific operation, I treat that as an immediate red flag.
Writing clear functions also keeps the team honest in the next step. Simply put, if you can’t say what a station is supposed to accomplish, you can’t say how it fails.
Step 4: PFMEA Failure Analysis and the Failure Chain
The AIAG and VDA handbook uses the idea of a failure chain: a failure cause leads to a failure mode, which then leads to a failure effect. According to the Quality Training Portal, identifying potential causes sits at the heart of a PFMEA, and I couldn’t agree more.
Where Teams Go Wrong
Here’s where I see the most damage done:
Vague failure modes. “Bad part” or “out of spec” tells you nothing. In contrast, a useful failure mode names the condition: “fastener under torqued,” “weld nut missing,” “seal not fully seated,” “wrong part variant installed.”
Operator error as a cause. Writing “operator error” in the cause column is the PFMEA equivalent of a shrug. Instead, ask why the operator would make that error. Are there two nearly identical parts in adjacent bins? Is there no positive stop on the fixture? Does the work instruction show a photo of last year’s model? In most cases, the real cause lives in the process design, and that’s the only place you can fix it.
Effects that stop at the plant door. The effect should consider your next operation, the customer’s assembly plant, and the end user. For example, a slightly mislocated bracket might be a minor fit issue at your end of line but a rattle complaint in the field. Because severity comes from the worst credible effect, your DFMEA’s end user effects need to feed into the PFMEA.
Write Each Chain as a Sentence
One habit helps a lot here. Write each failure chain as a sentence: “Because the clamp pad is worn (cause), the panel shifts during welding (mode), which results in a weld out of position and possible loss of joint strength in a crash (effect).” If the sentence doesn’t make sense out loud, then the row doesn’t make sense either.
Step 5: PFMEA Risk Analysis and Why Action Priority Replaced RPN
For decades, teams multiplied Severity × Occurrence × Detection to get a Risk Priority Number. Then they worked on everything above an arbitrary threshold like 100 or 125. In fact, even ASQ’s own FMEA example talks about lowering RPNs below 125.
Why RPN Fell Short
The problem is that RPN treats very different risks as equal. For example, a severity 10 failure with occurrence 2 and detection 5 gives you an RPN of 100. Yet a severity 4 failure with occurrence 5 and detection 5 also gives you 100. Nobody in their right mind would treat those as the same risk, but the math does.
How Action Priority Works in a PFMEA
That’s why the harmonized handbook swapped RPN for Action Priority. As ReliaMag’s FMEA guide puts it, AP relies on lookup tables instead of multiplication, gives severity the most weight, and sorts every failure chain into High, Medium, or Low. In short, High means you need to act or document a strong justification. Medium means you should act. Low means you could act.
There’s also research suggesting AP can reduce wasted FMEA effort compared with RPN thresholds. If you want the data side of the argument, Matthew Barsalou’s study on reducing FMEA efforts with Action Priority is worth a read.
Rating Rules I Enforce on Every PFMEA
Here are a few rating rules I enforce on every team:
- Severity is about the effect, not the cause. You don’t lower severity by adding an inspection. In most cases, only a design change can lower it.
- Back occurrence with data whenever you have it. If your scrap reports say a cause shows up weekly and the PFMEA says occurrence 2, then the PFMEA is wrong.
- Rate detection on the actual control, not the intended one. “100% visual inspection” does not deserve a strong detection rating. After all, people miss things, especially at hour seven of a shift. On the other hand, automated, verified detection at the station where the failure happens earns the better ratings.
- Separate prevention from detection. Prevention controls affect occurrence, whereas detection controls affect detection. Mixing them up is one of the most common errors I see.
Step 6: PFMEA Optimization
Everything before this point is analysis. Optimization, however, is where risk actually goes down, and it’s the step that truly prevents defects.
Follow the Control Hierarchy
The order of preference matters. In my experience, this hierarchy holds up across stamping, welding, molding, and final assembly:
- Eliminate the cause by design change (part or process). For instance, if two variants look identical, ask design to add a feature that makes them distinguishable or makes it physically impossible to install the wrong one.
- Prevent the cause with error proofing. Think fixtures that only accept the correct orientation, sensors that block the cycle if a component is missing, and nutrunners that won’t release the part until torque and angle both fall in window.
- Detect the failure mode at the station where it happens, automatically, before the part moves on.
- Detect it downstream, again automatically.
- Detect it by human inspection. This is the last resort, not the plan.
Own and Verify Every PFMEA Action
Every action needs an owner, a due date, and a revised rating once the team completes and verifies it. Notably, “train operators” is not an action that lowers occurrence in any meaningful way, and most auditors I know will challenge it. Training is necessary, but it isn’t a control.
I also push teams to verify actions before they rate again. If you installed a part presence sensor, prove it works by running known bad parts through it. Otherwise, you risk a classic escape path: an error proofing device that someone bypassed during a maintenance call and never switched back on. For that reason, I like to see daily verification of error proofing devices written into the control plan.
Step 7: Results Documentation
The handbook is clear on this point. Indeed, the Quality Training Portal notes that an FMEA study isn’t finished until the team completes step 7. Here, you summarize residual risk, communicate it to management and the customer when needed, and tie the results into the rest of the quality system.
In plain terms, step 7 is where your PFMEA connects to everything else.
The PFMEA Linkage Auditors Look For First
If you’ve been through an IATF 16949 audit, you know the drill. First, the auditor picks a station and pulls the control plan. Next, they ask you to show the PFMEA row behind each control. Then they walk to the line and check whether the work instruction and the operator’s actual work match both documents.
IATF 16949 clause 9.1.1.1 requires the organization to verify that it has actually implemented the process flow diagram, PFMEA, and control plan. Similarly, Industry Forum’s analysis of IATF major nonconformities lists the usual findings: control plans that don’t reflect the observed process, process changes that never made it into the PFMEA and control plan, and gaps in how special characteristics cascade into process documents.
Here’s my rule of thumb for linkage:
- Use the same operation numbering everywhere. If welding is OP 30 in the process flow, it’s OP 30 in the PFMEA, the control plan, and the work instruction.
- Every High and Medium AP row should have a corresponding control in the control plan, with a reaction plan.
- Every special characteristic should trace from the drawing, through the DFMEA, into the PFMEA, and onto the control plan.
- Every control plan row should trace back to a PFMEA risk. If it doesn’t, then either the control is unnecessary or the PFMEA is missing a failure mode.
Keeping Your PFMEA Alive
Most teams build PFMEAs carefully during APQP and then abandon them after PPAP. In fact, that’s exactly where the brake bracket story from the opening came from. The document was accurate on launch day. It just never changed after that.
Therefore, review and update a PFMEA whenever any of these happen:
- A customer complaint or internal escape
- A process change, equipment change, or tooling rebuild
- A material or supplier change
- A new failure mode found during problem solving
- Scrap or rework data that contradicts the occurrence ratings
- A lessons learned from a similar product or plant
The simplest discipline I’ve seen work is this: no team can close an 8D or corrective action until it has reviewed the PFMEA and control plan and either updated them or documented why no update was needed. As a result, that one rule keeps the document honest.
Reverse PFMEA: Checking Your Work on the Floor
The best tool I’ve found for keeping a PFMEA tied to reality is the Reverse PFMEA. Not surprisingly, more OEMs are writing it into their customer specific requirements. As Omnex explains, its purpose is to prove that teams actually handle the risks in the PFMEA once production starts, because suppliers don’t always verify how effective their planned controls are at launch. Furthermore, according to EASE, Ford’s customer specific requirements call for a reverse FMEA on all new equipment launches.
AIAG describes the goal simply: making sure your PFMEA matches your process, and your process matches your PFMEA.
How I Run a Reverse PFMEA
- Prepare. First, pick a station. Then pull the PFMEA rows, the control plan, the work instructions, and six months of scrap, rework, and complaint data for that operation.
- Go to the station. Stand there with the team, including at least one person who didn’t help write the original PFMEA. Fresh eyes catch assumptions the original team can’t see anymore.
- Challenge each control. Is the sensor actually installed? Does it catch a deliberately bad part? Is the operator doing the check the way the instruction says? Is the instruction even posted?
- Look for what’s missing. Watch a full cycle, a changeover, and a restart after a stop. Meanwhile, note any failure mode or cause the document doesn’t cover.
- Compare ratings to data. Plexus International gives a good example: if a line produces $80,000 of scrap from a cause the team rated low on occurrence, the rating is clearly wrong and needs to come up.
- Update and act. Finally, revise the PFMEA, control plan, and instructions, and assign actions for any High AP items that came out of the review.
The first Reverse PFMEA on a mature line is always humbling. To this day, I have yet to run one that didn’t find at least one control that existed only on paper.
PFMEA Mistakes I See Over and Over
After reviewing hundreds of these, I keep seeing the same problems:
- Copying a template from another program without walking the new process. After all, the fixture is different, the cycle time is different, and the operators are different.
- Rating to hit a number. Teams that lower occurrence or detection ratings to avoid action items are building risk into the document. Consequently, auditors and customers spot this quickly.
- Writing “operator error” as a cause instead of asking what in the process allows the error.
- Treating visual inspection as strong detection.
- Leaving out rework, repair, and offline operations. Rework is a process, so it needs its own PFMEA coverage.
- Never revisiting the document after PPAP.
- Building it alone. One engineer simply cannot know every way a process fails.
A Final Word From the Floor
The point of a PFMEA was never the document. Instead, it’s the conversations it forces: between design and manufacturing, between engineering and the operators, and between what you planned and what’s actually happening at the station. When a team takes those conversations seriously, defects stop showing up at the customer’s dock. When they don’t, however, you get a beautiful 47 page file and a containment call on a Friday night.
So build it with the right people. Base your ratings on data. Push for error proofing over inspection. Tie it to your control plan. And above all, go back to the floor regularly to prove it’s still true.
Frequently Asked Questions About PFMEA
What is the difference between a PFMEA and a DFMEA?
A DFMEA looks at how a product design could fail to meet its intended function. By contrast, a PFMEA looks at how the manufacturing or assembly process could fail to produce the part as designed. The DFMEA also passes severity and special characteristics down to the PFMEA. The Quality Digest overview explains how end user effects flow from the design FMEA into the process FMEA.
Is RPN still allowed in automotive PFMEAs?
Most OEMs that have adopted the harmonized handbook expect Action Priority instead of RPN. Even so, some customer specific requirements still mention RPN, so always check your customer’s requirements. The AIAG FMEA page lists the OEMs that accept the AIAG and VDA approach.
How often should a PFMEA be updated?
Update it whenever there’s a process change, a customer complaint, a new failure mode, or data that contradicts your ratings. In addition, review it on a regular schedule. Industry Forum notes that unreflected process changes rank among the most common IATF audit findings.
Who should be on a PFMEA team?
At a minimum, include process engineering, quality, production, and maintenance, plus design engineering for linkage to the DFMEA. Operators and material handlers also add huge value. The ASQ FMEA resource stresses the importance of a cross functional team.
What is a Reverse PFMEA?
It’s a shop floor review that checks whether the controls in the PFMEA are actually in place and working, and whether the team missed any failure modes. Both Omnex and AIAG cover it in detail.
Does a High Action Priority always require an action?
High AP means the team must identify an action to improve prevention or detection, or else document a justification for why current controls are adequate. ReliaMag’s guide explains how the AP tables work.
Can visual inspection be used as a detection control?
Yes, but rate it as a weak detection method, and don’t make it the main control for high severity failure modes. Instead, rely on error proofing and automated detection, which are much stronger.
References
- Automotive Industry Action Group. Failure Mode and Effects Analysis and the AIAG and VDA FMEA Handbook.
- American Society for Quality. Failure Mode and Effects Analysis (FMEA).
- Rowzee, M. Quality Digest. Understanding AIAG and VDA’s FMEA Process and Approach.
- Quality Training Portal. AIAG and VDA Seven Step PFMEA Process.
- ReliaMag. How to Perform FMEA: Methodology and Worked Examples.
- Barsalou, M. Management and Production Engineering Review. Investigation into a Potential Reduction of FMEA Efforts Using Action Priority.
- Industry Forum. IATF 16949 Common Nonconformities and How to Address Them.
- Omnex. Reverse FMEA: A New and Upcoming Customer Specific Requirement.
- AIAG Blog. AIAG Announces New Reverse Process FMEA Fundamentals Course.
- EASE. Reverse FMEA Basics for Manufacturers.
- Plexus International. Validating Your Performance Using Reverse FMEA.