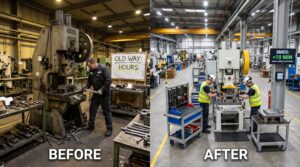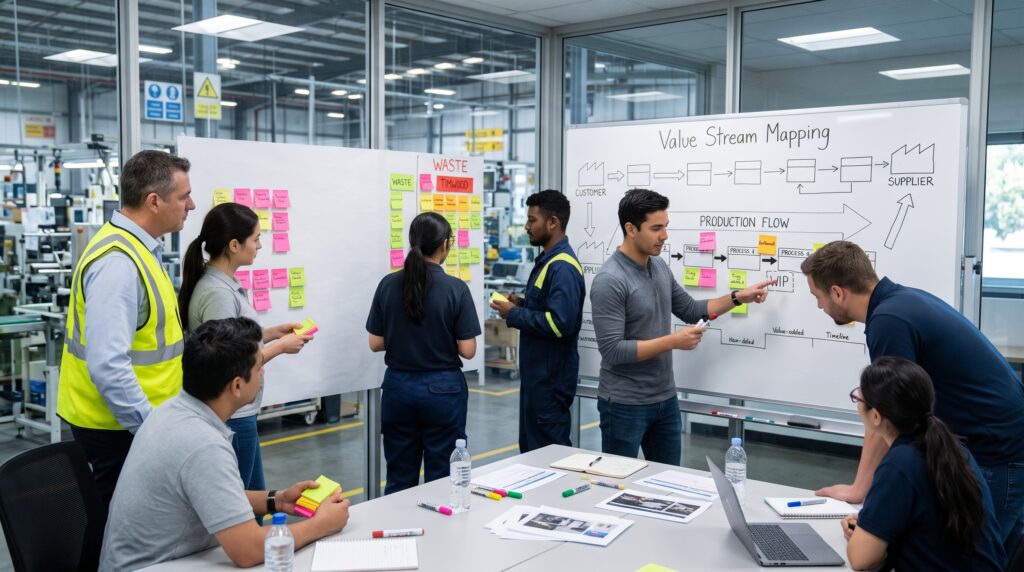
Manufacturing professionals use value stream mapping to identify workflow inefficiencies, eliminate waste, and improve production flow.
The first value stream mapping session I ever led produced a map that was wrong. I drew it in a conference room with a plant manager, two supervisors, and a routing sheet printed from the ERP system, and honestly, it was beautiful. Clean boxes, neat arrows, every process in the right order. Then my own sensei took the marker out of my hand, pointed at the door, and said, “Go find out what actually happens.” Forty minutes on the floor later, I had found a rework loop nobody had mentioned, a pallet of parts that had sat by the paint booth for nine days, and a scheduler who kept a second, handwritten schedule in his desk drawer because he didn’t trust the official one.
That walk taught me more than any book did. Since then, I’ve been teaching the same lesson to plant teams for a long time. A value stream map isn’t a drawing of how your process is supposed to work. Instead, it’s a record of how it actually works, made by people who went and looked.
In this guide, I’ll show you how I run value stream mapping with clients in stamping, machining, molding, fabrication, and assembly. Specifically, we’ll cover what to map, how to walk it, which numbers matter, how to spot waste on the page, and how to turn the map into changes that last after the sticky notes come off the wall.
What Value Stream Mapping Actually Is
Value stream mapping is a lean method for seeing everything it takes to get one product family from raw material to the customer’s dock. In other words, it captures the material flow, the information flow that drives it, and the time that passes along the way. The Lean Enterprise Institute describes it in Learning to See as starting with a map of the current state, finding the sources of waste, and then drawing a leaner future state along with a plan to get there.
However, plenty of people confuse it with process mapping, and the difference matters. A process map or flowchart shows steps and the order they happen in. By contrast, a value stream map shows the steps too, but it also shows the inventory piling up between them, the time each piece waits, how the schedule reaches each process, and how all of that adds up to total lead time. Quality Magazine makes this point well: unlike a process map, a value stream map is tied directly to lean thinking and pulls processing methods, information flow, and performance data together on one page.
Why does that matter? Because most of your waste isn’t inside the processes. Rather, it sits in the gaps between them. Your press might run beautifully, and your welders might be the best in the region. Even so, parts can still take three weeks to get through a building where the actual work takes less than five minutes. You won’t see that on a flowchart, but you will see it on a value stream map.
Why I Start Almost Every Engagement With Value Stream Mapping
Clients sometimes ask why we’re “drawing pictures” when they hired me to cut cost. That’s a fair question, so here’s my answer.
Without a map, improvement turns into a hunt for whatever problem is loudest. For example, somebody wants a new machine. Meanwhile, somebody else wants 5S in the tool crib, and maintenance wants a CMMS upgrade. All of those might be good ideas. Still, nobody can say which one moves the needle for the customer, because nobody has seen the whole system at once.
Value stream mapping, on the other hand, gives everyone the same picture. The Lean Enterprise Institute’s own overview of why value stream mapping matters makes the point that it helps you see beyond a single process and understand how the flow works as a whole. Once a team can see that the real constraint is a weekly batch release from planning and not the welding cell, the arguments stop and the right work starts.
There’s also a human reason. When operators, schedulers, buyers, and supervisors stand around the same map, they finally see each other’s problems. I once watched a materials planner realize, mid workshop, that the “urgent” orders she pushed every Thursday were the reason the machine shop broke setups three times a week. Nobody had been doing anything wrong. In fact, they just couldn’t see the system.
Step 1: Pick One Product Family for Value Stream Mapping
The most common mistake I see is a team trying to map everything. Typically, they roll out butcher paper across a 40 foot wall and try to capture every part number. Three days later, they have a map so dense nobody can read it.
So pick one product family. A product family is a group of products that pass through similar processing steps and similar equipment. The quickest way to find one is a simple matrix. First, list your products down the left side. Next, list your major processes across the top, and then mark which product touches which process. Groups with matching patterns are your families. ASQ’s value stream mapping guide walks through this same product family matrix and recommends looking at processes from a high level before going into detail.
How to Choose Your First Family
How do you choose which family to map first? I ask three questions:
- Which family matters most to your customers or your revenue right now?
- Where are the late deliveries, quality complaints, or expediting costs coming from?
- Finally, which family has a leader who will own it after the workshop ends?
That third question gets skipped, and it shouldn’t. After all, Mike Rother and John Shook built the idea of a value stream manager into their method for a reason. If no single person owns the flow from end to end, the future state stays a poster.
Step 2: Set the Boundaries Door to Door
For a first map, I keep the scope “door to door,” meaning from the moment raw material arrives at receiving to the moment finished goods leave on a truck. Of course, you can map extended value streams across suppliers and distribution centers later, once your team knows how to see. For now, start inside your own four walls where you can actually change things.
Write down the scope before you walk. Usually one sentence is enough: “Bracket family A, from coil receiving to shipping dock, for our largest automotive customer.” It sounds trivial. Yet I’ve watched teams waste an entire afternoon arguing about whether the outside plating vendor is “in” the map, so decide it up front.
Step 3: Build the Right Value Stream Mapping Team
Value stream mapping isn’t a solo activity for the continuous improvement engineer. In my experience, the best maps come from teams of five to eight people who touch the flow in different ways. On a typical team I want:
- The value stream owner or plant manager
- One or two operators or team leads from the floor
- A production scheduler or planner
- A representative from materials, purchasing, or logistics
- Someone from quality
- Maintenance or engineering, especially if equipment uptime is a known issue
- A facilitator who has done this before
ASQ’s own guidance recommends a team drawn from different departments and also notes that someone experienced with value stream mapping should facilitate. In addition, I’d add one more rule: at least one person on the team should be someone who does the work every single day. That’s because operators know things that never show up in any system.
Step 4: Walk the Flow, Backward, With a Pencil
This is the part people want to skip, and yet it’s the part that matters most.
Go to the gemba and walk the actual path the product takes. Bring a clipboard, a pencil, a stopwatch, and comfortable shoes. Leave the laptop behind, and don’t use the ERP routing as your source of truth.
Why I Start at Shipping
I walk the flow starting at shipping and moving upstream toward receiving, and there’s a practical reason for that. Starting at the customer end keeps your attention on what the customer actually pulls. It also forces you to ask, at every step, “What triggers this process to make something?” As a result, you find the information flow much faster.
The Data Value Stream Mapping Needs at Each Process
At each process, collect real data with your own eyes:
- Cycle time: how long it takes to complete one piece, or how often a piece comes off the process
- Changeover time: time from the last good piece of one part to the first good piece of the next
- Uptime: how much of the available time the equipment is actually running
- Number of operators
- Batch size or lot size
- First pass yield or scrap rate
- Available working time per shift, after breaks and meetings
After that, count the inventory between processes. Physically count it, including the parts in the racks, on the floor, in the bins, on the carts, and hiding behind the machine. I’ve lost count of how many times “about two pallets” turned into seven once somebody actually looked.
Why Pencil Beats a Screen
Draw your map in pencil while you walk. The ASQ guide even suggests that on early workshops, team members sketch their own maps on paper, ideally in pencil, while the facilitator builds the shared version. Pencil means you can fix things. Just as important, it signals that this is a working document, not a presentation.
Step 5: Draw the Current State Map
Back in the room, build the current state map on a big sheet of paper or a whiteboard. There’s a standard layout, and it’s worth following, because once your people learn it they can read any map in any plant.
Upper right corner: the customer, with their monthly or daily demand, how often they ship, and the packaging they want.
Upper left corner: your suppliers, with delivery frequency and lot sizes.
Center of the top half: production control and the information flow. How do forecasts and orders come in? How do they get turned into schedules? Who gets the schedule, how often, and in what form? Draw electronic information as a lightning bolt arrow and manual information as a straight arrow.
Middle band: the process boxes, left to right, in the order the product moves. Under each box, add a data box with the cycle time, changeover, uptime, operators, and so on.
Between processes: inventory triangles with the quantity you counted, plus push arrows showing that material is being pushed to the next step whether it’s needed or not.
Bottom of the page: the timeline. This is the line that changes minds.
Step 6: Build the Timeline and Calculate Your Lead Time
The timeline has two levels. The upper level is waiting time, meaning the days your product sits as inventory. Meanwhile, the lower level is processing time, the seconds or minutes where something is actually being done to the part.
Converting Inventory Into Days
To turn inventory into days, divide the inventory quantity by daily customer demand. For instance, if you have 6,000 blanked brackets sitting between the press and the welding cell, and the customer takes 1,800 a day, those parts represent about 3.3 days of lead time.
A Value Stream Mapping Example From a Stamping Plant
Here’s a real example from a stamping and weld plant I worked with, rounded off:
| Location | Inventory | Lead Time | Processing Time |
|---|---|---|---|
| Raw coil | 9,000 pcs equivalent | 5.0 days | |
| Stamping | 1 second | ||
| After stamping | 5,000 pcs | 2.8 days | |
| Spot weld | 46 seconds | ||
| After weld | 2,700 pcs | 1.5 days | |
| Paint | 62 seconds | ||
| After paint | 5,400 pcs | 3.0 days | |
| Assembly | 40 seconds | ||
| Finished goods | 3,600 pcs | 2.0 days | |
| Total | 14.3 days | 149 seconds |
In short, that’s fourteen days of lead time for about two and a half minutes of actual work. When the plant manager saw that number, he didn’t say anything for a while. Then he asked how many of those parts had been scrapped over the past year because of engineering changes while they sat in the racks. That’s exactly the conversation you want.
Don’t be shocked if your ratio looks like this. In almost every first map I’ve facilitated, value added time is a tiny fraction of total lead time, often well under one percent. Even so, that isn’t a failure of your people. It’s simply what batch and push systems naturally produce.
Step 7: Calculate Takt Time
Takt time is the rate the customer needs you to produce at. Put simply, it’s the heartbeat your whole value stream should be paced to.
The formula is straightforward: available working time per day divided by customer demand per day.
Using the same plant, two shifts each had 480 minutes, minus 30 minutes of breaks per shift, which gives 900 minutes, or 54,000 seconds, of available time. Demand was 1,800 pieces per day. Therefore, 54,000 divided by 1,800 gives a takt time of 30 seconds.
Next, compare takt to the cycle times on your map. In that plant, paint ran at 62 seconds per piece on one line. Against a 30 second takt, that line could never keep up without overtime, a second shift, or a second booth. Interestingly, the team had blamed “absenteeism” for paint falling behind, but the math said otherwise. Tooling U SME’s future state course treats takt time as central to building the future state for exactly this reason. Simply put, you can’t design flow if you don’t know the pace you’re designing for.
Step 8: Use Value Stream Mapping to Find the Waste
Now you hunt. I teach teams to look at their current state map with the eight wastes in mind. Taiichi Ohno originally named seven, and most lean practitioners today add an eighth.
The Eight Wastes
- Overproduction: making more, or making it sooner, than the next process needs. Look for push arrows and big inventory triangles. This is the worst waste because it creates most of the others.
- Waiting: parts waiting for machines, operators waiting for parts, everyone waiting for a schedule. In fact, your timeline’s upper level is mostly waiting.
- Transportation: moving material further or more often than needed. If you draw the forklift routes on a plant layout, you’ll often see spaghetti.
- Overprocessing: doing more than the customer is paying for, such as tighter tolerances than needed, an extra inspection nobody can explain, or a deburr step on a hidden edge.
- Inventory: every triangle on your map. Inventory hides problems, eats floor space, and also ties up cash.
- Motion: people walking, reaching, and searching for tools. Fortunately, you’ll catch this on your walk if you watch operators for a full cycle.
- Defects: scrap, rework, and anything that fails first time. Look for low yields in your data boxes and rework loops you didn’t expect.
- Unused talent: for example, the operator who has known for two years how to cut the changeover in half and was never asked.
Mark every place you see waste with a kaizen burst, the jagged starburst symbol, right on the map. At this stage, don’t solve anything yet. Just mark it.
Patterns Value Stream Mapping Reveals Again and Again
A few patterns show up over and over in industrial plants:
Multiple schedule points. If the scheduler sends a separate schedule to every process, every process acts like its own little factory, and consequently inventory piles up everywhere. Instead, you want one pacemaker process that gets the schedule, with upstream processes pulled from it.
Long changeovers driving big batches. A press that takes two hours to change will be run in huge batches, and those batches then flood the downstream racks. Fix the changeover, and as a result the batches can shrink.
The hidden second schedule. If your supervisors keep their own list, your formal system has lost their trust. That’s an information flow problem, so it belongs on the map.
Step 9: Design the Future State
With the current state on the wall and the waste marked, you can now design the future state. This is where people get excited, and it’s also where they get into trouble, so I keep a firm hand on it.
Keep the Horizon Realistic
A future state map is not a perfect world. Rather, it’s a realistic, better version of your value stream that you can reach in roughly six to twelve months. Jeff Hajek’s notes on value stream analysis use the same horizon, and it’s the one I’ve found works. If you go shorter than that, you only draw small tweaks. On the other hand, if you go longer, nobody believes it.
The Value Stream Mapping Questions I Ask Every Team
When I facilitate a future state, I walk the team through questions adapted from the original Rother and Shook guidelines:
- What is the takt time?
- Will we build to a finished goods supermarket or directly to shipping?
- Where can we use continuous flow, with one piece moving from step to step without stopping?
- In places where we can’t flow yet, will we use supermarket pull or first in, first out lanes to control the gap?
- Which single process will receive the customer schedule? That’s your pacemaker.
- How will we level the mix and volume at the pacemaker?
- What increment of work will we release, and how often?
- Finally, what process improvements, like faster changeovers or better uptime, are needed to make all of that work?
What the Stamping Plant Changed
In the stamping and weld plant, the future state put the weld and assembly steps into one cell running to takt. In addition, it set up a small supermarket of stamped blanks pulled by kanban, made the assembly cell the pacemaker, and cut press changeovers so blanks could be run in daily lots instead of weekly ones. Consequently, the future state timeline showed about 4.5 days of lead time instead of 14.3. The processing time barely changed, but everything else did.
Don’t Skip the Current State
One warning I give every team is this: don’t skip the current state because you’re eager to get to ideas. A Lean Journey makes the same point bluntly. If you don’t understand the current process, you can’t make intelligent decisions about the future one. For example, I’ve seen companies jump straight to “let’s install kanban everywhere” and create a mess, simply because they never understood why inventory was accumulating in the first place.
Step 10: Turn Value Stream Mapping Into a Plan, and Keep Walking
A map with no plan behind it is wallpaper. I’ve walked into plants where a value stream map from five years ago was still taped to the conference room wall, faded and curling, with nothing on it ever done.
To avoid that, take every kaizen burst on the future state and turn it into a specific project with an owner, a target, and a date. Then group them into loops. I usually start with the pacemaker loop, the section closest to the customer, because improving it pulls improvement upstream. After that, work back toward receiving.
Put the plan on a single page, and review it on a regular cadence, ideally every week at the gemba rather than in a meeting room. When a loop is done, redraw that section of the map. Once the whole future state is achieved, that future state becomes your new current state, and you map again. Likewise, the NHS England improvement overview frames value stream mapping as suitable for manufacturing, logistics, supply chain, and many service settings. In every one of them, the cycle is the same: map, improve, remap.
Value Stream Mapping Mistakes I See Teams Make Over and Over
After many workshops, here are the traps I warn people about before we start:
Mapping from the office. If your data came from the ERP system and nobody walked the floor, it isn’t a value stream map. Instead, it’s a guess with boxes.
Too much detail. A value stream map is a system view, so don’t break each process into its twenty work elements. Save that for a process map or a standard work study later.
Mapping too small. This is the opposite trap. One cell on its own isn’t a value stream, because you need to see the handoffs.
Making it pretty first. Digital tools are fine once you know what you’re drawing. However, the first version should be pencil and paper, done by the team, in the room.
Leaving operators out. If the people who run the process aren’t in the room, you’ll miss half the waste and also get none of the buy in.
No owner. Without a value stream manager, the future state is everyone’s job, which in practice means nobody’s.
Treating it as a one time event. Value stream mapping is a habit, not a project. Indeed, the plants that get real results remap every year or so, and every time they see more.
Value Stream Mapping for High Mix, Low Volume Shops
Job shops and fabricators often tell me value stream mapping doesn’t apply to them because “every job is different.” I understand the feeling, but I don’t buy it. Even in high mix environments, jobs tend to follow a handful of routing patterns. So group by routing, not by part number, and you’ll find your families. The Lean Enterprise Institute has written specifically about value stream mapping in low volume, high mix settings, and the core message holds up. In other words, the method flexes, but the discipline of going to see and measuring the gaps doesn’t change.
Final Thoughts on Value Stream Mapping From the Floor
If you take one thing from this article, let it be this: value stream mapping is a way of learning to see, not a way of making a diagram. The diagram is just evidence that you looked.
Jim Womack has said that he and his colleagues at the Lean Enterprise Institute introduced value stream mapping because people needed a simple way to see their whole flow instead of fixing isolated processes. You can hear him talk about that history in the Lean Enterprise Institute’s video on the origins of value stream mapping. Decades later, it still works for the same reason. When a team walks the flow together, counts the parts, and puts real numbers on a timeline, nobody can unsee what they’ve found.
So pick a product family, gather a small team, and grab a pencil. Then start at the shipping dock and walk upstream. After all, the waste is already there, waiting for someone to notice it.
Frequently Asked Questions About Value Stream Mapping
What is the main purpose of value stream mapping?
The purpose is to see how material and information flow through a product family from end to end, so you can find where time and effort are wasted and then design a better flow. ASQ describes it as a lean tool that documents every step in a process and helps teams build a solid implementation plan.
What is the difference between a current state map and a future state map?
A current state map shows how the process works today, based on direct observation. In contrast, the future state map shows how the value stream should run after improvements, usually six to twelve months out. Creately’s value stream mapping guide explains how the current state serves as the baseline for comparison.
How long does a value stream mapping event take?
Generally, a focused current and future state workshop for one product family takes two to three days, including the floor walk. ASQ outlines a typical three day value stream mapping kaizen event agenda.
Is value stream mapping only for manufacturing?
No. Although it started in manufacturing, it’s widely used in logistics, supply chain, healthcare, and office processes. The NHS England overview notes it suits most businesses, including service organisations.
What data do I need to collect for a value stream map?
At minimum, you need cycle time, changeover time, uptime, number of operators, batch size, yield, available working time, and inventory counts between processes, plus customer demand to calculate takt time. Tooling U SME covers how current state data and takt time feed future state design.
What book should I read to learn value stream mapping?
Start with Learning to See by Mike Rother and John Shook, published by the Lean Enterprise Institute. It’s the workbook that introduced value stream mapping to most practitioners, and it walks through a full current to future state example.
References
- Rother, M., & Shook, J. Learning to See: Value Stream Mapping to Add Value and Eliminate Muda. Lean Enterprise Institute.
- Lean Enterprise Institute. Insights on Why, When, and How Value Stream Mapping Is a Vital Part of Continuous Improvement. The Lean Post.
- Womack, J. Jim Womack Explains the Origins and Value of Value Stream Mapping. Lean Enterprise Institute.
- American Society for Quality. What Is Value Stream Mapping (VSM)? ASQ Quality Resources.
- Quality Magazine. Charting and Mapping.
- NHS England Improvement Hub. An Overview of Value Stream Mapping.
- Tooling U SME. Value Stream Mapping: The Future State 311.
- Hajek, J. Value Stream Analysis. Velaction.
- Creately. Value Stream Mapping Tutorial: What Is a VSM and How to Create a Value Stream Map.
- A Lean Journey. Value Stream Mapping: The Current State and Future State.